Cluster Autoscaler Stats 3,878,2343,878,234
Description
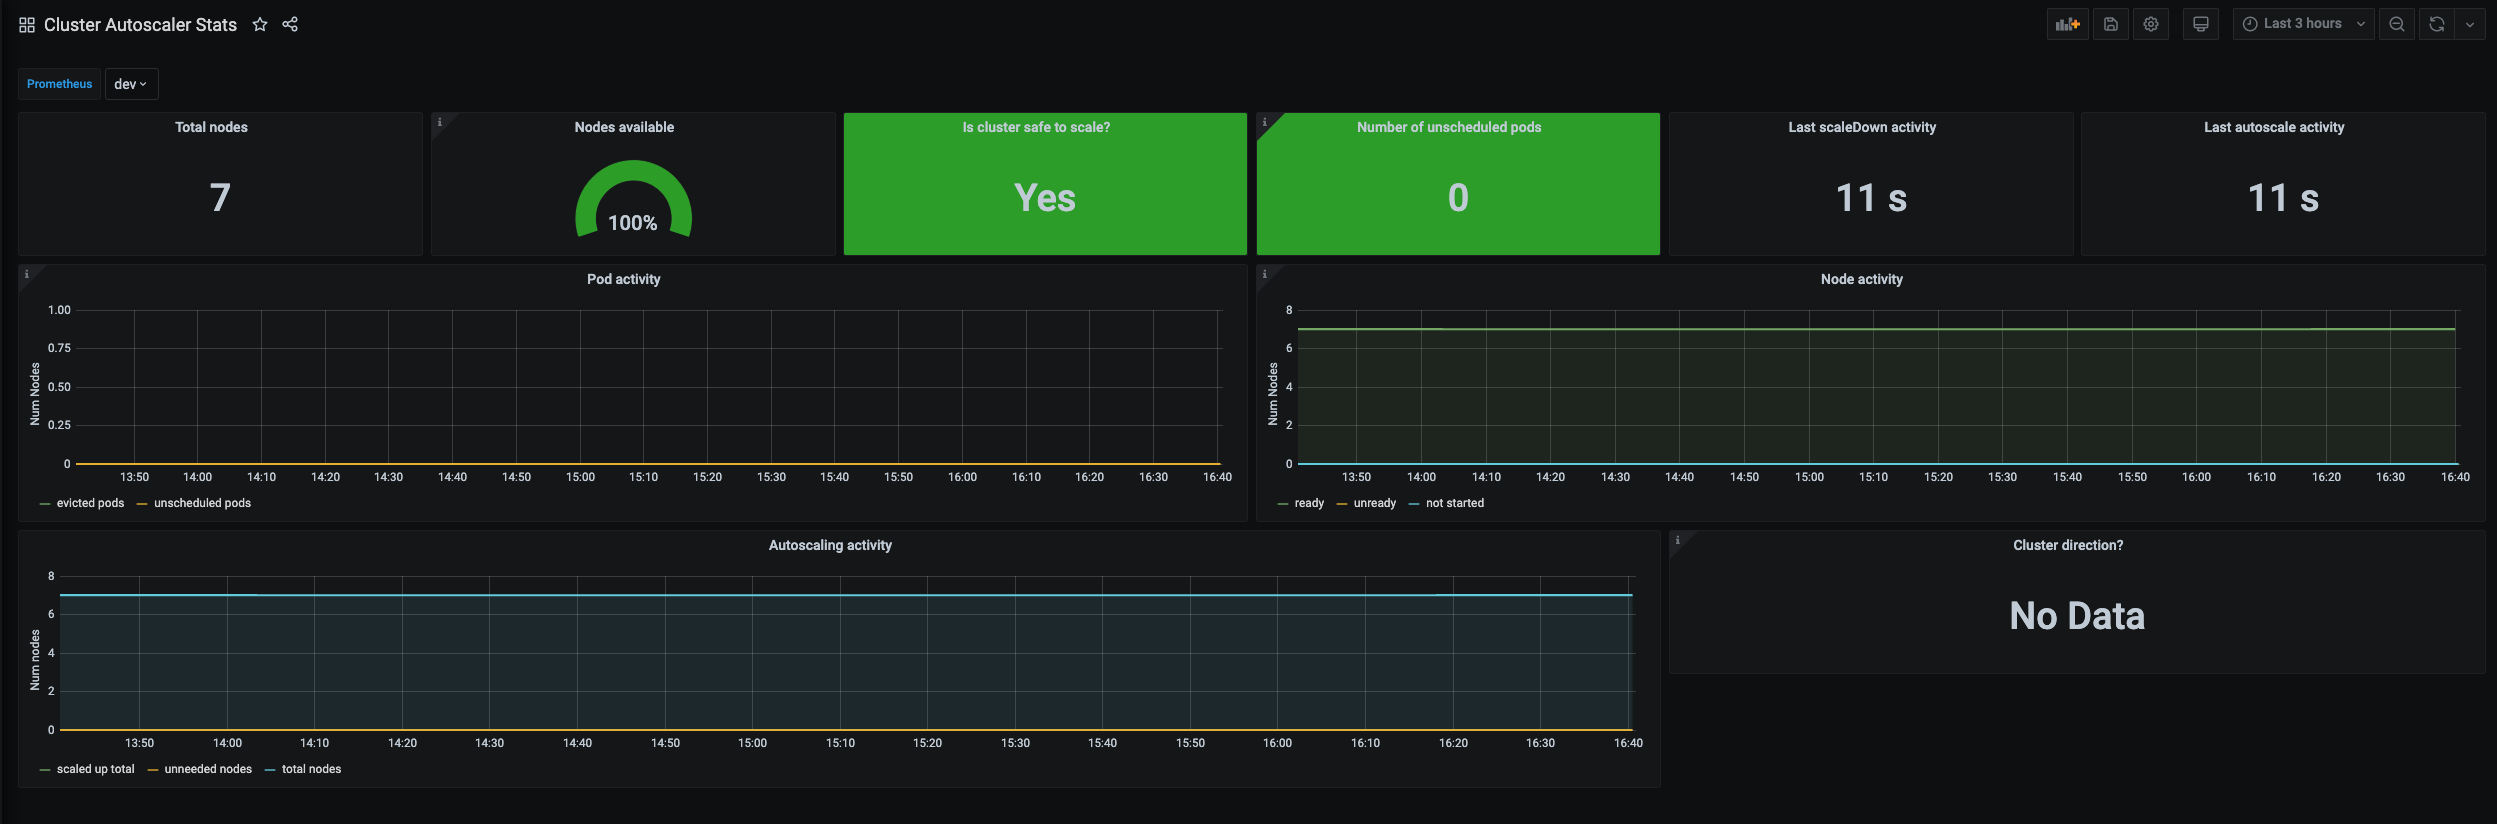
This dashboard monitors dynamic scaling activity and health of a Kubernetes cluster, focusing on how the autoscaler adjusts nodes and handles workloads. It highlights key signals such as cluster_autoscaler_nodes_count and scaling safety with cluster_autoscaler_cluster_safe_to_autoscale, as well as pod and node churn through cluster_autoscaler_unschedulable_pods_count and cluster_autoscaler_scaled_up_nodes_total / cluster_autoscaler_scaled_down_nodes_total. Together, the panels track current cluster size, safety status, unscheduled workload pressure, and recent autoscale events like scale up/down and last activity timestamps.
Screenshots
Used Metrics 88
cluster_autoscaler_cluster_safe_to_autoscale
cluster_autoscaler_evicted_pods_total
cluster_autoscaler_last_activity
cluster_autoscaler_nodes_count
cluster_autoscaler_scaled_down_nodes_total
cluster_autoscaler_scaled_up_nodes_total
cluster_autoscaler_unneeded_nodes_count
cluster_autoscaler_unschedulable_pods_count