CloudFlare Zone Analytics 54,53554,535
10/9/2020
3/30/2021
3
>=7.1.5
Prometheus
Description
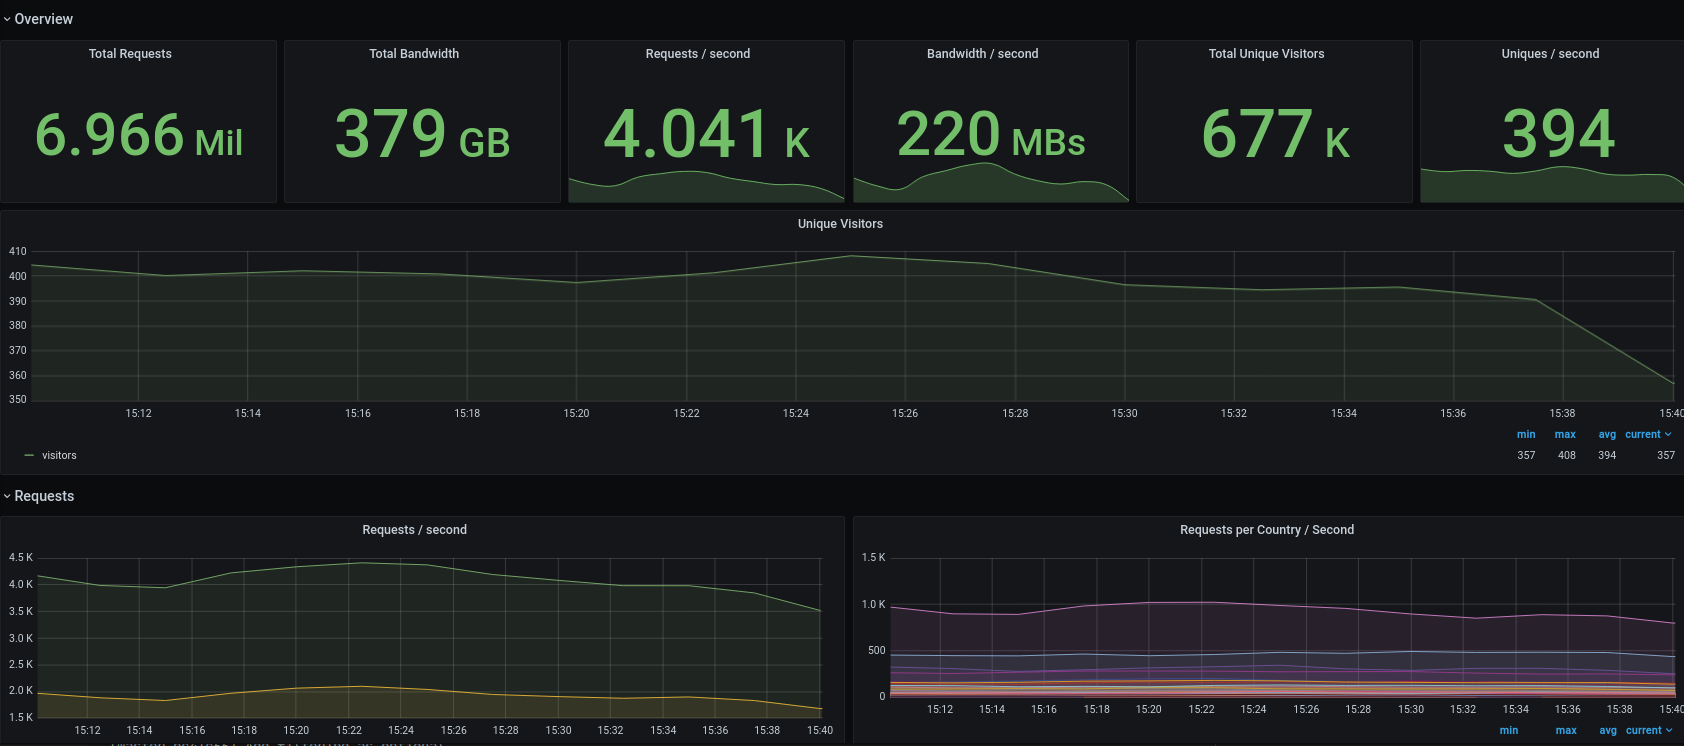
This dashboard monitors Cloudflare zone traffic and performance, providing real-time and historical insights into request volume, bandwidth, and visitor activity. It highlights throughput and reliability through metrics such as cloudflare_zone_requests_total, cloudflare_zone_bandwidth_total, and cloudflare_zone_uniques_total, while also offering breakdowns by geography, status codes, and content type to identify regional load, error rates, and content-type distribution across the zone.
Screenshots
Used Metrics 88
cloudflare_zone_bandwidth_total
cloudflare_zone_requests_cached
cloudflare_zone_requests_content_type
cloudflare_zone_requests_country
cloudflare_zone_requests_ssl_encrypted
cloudflare_zone_requests_status
cloudflare_zone_requests_total
cloudflare_zone_uniques_total
Get Dashboard✕
Download
Copy to Clipboard