ClickHouse 30,09230,092
4/6/2021
4/15/2021
4
Databases
>=7.5.2
Prometheus
Description
ClickHouse internal exporter metrics
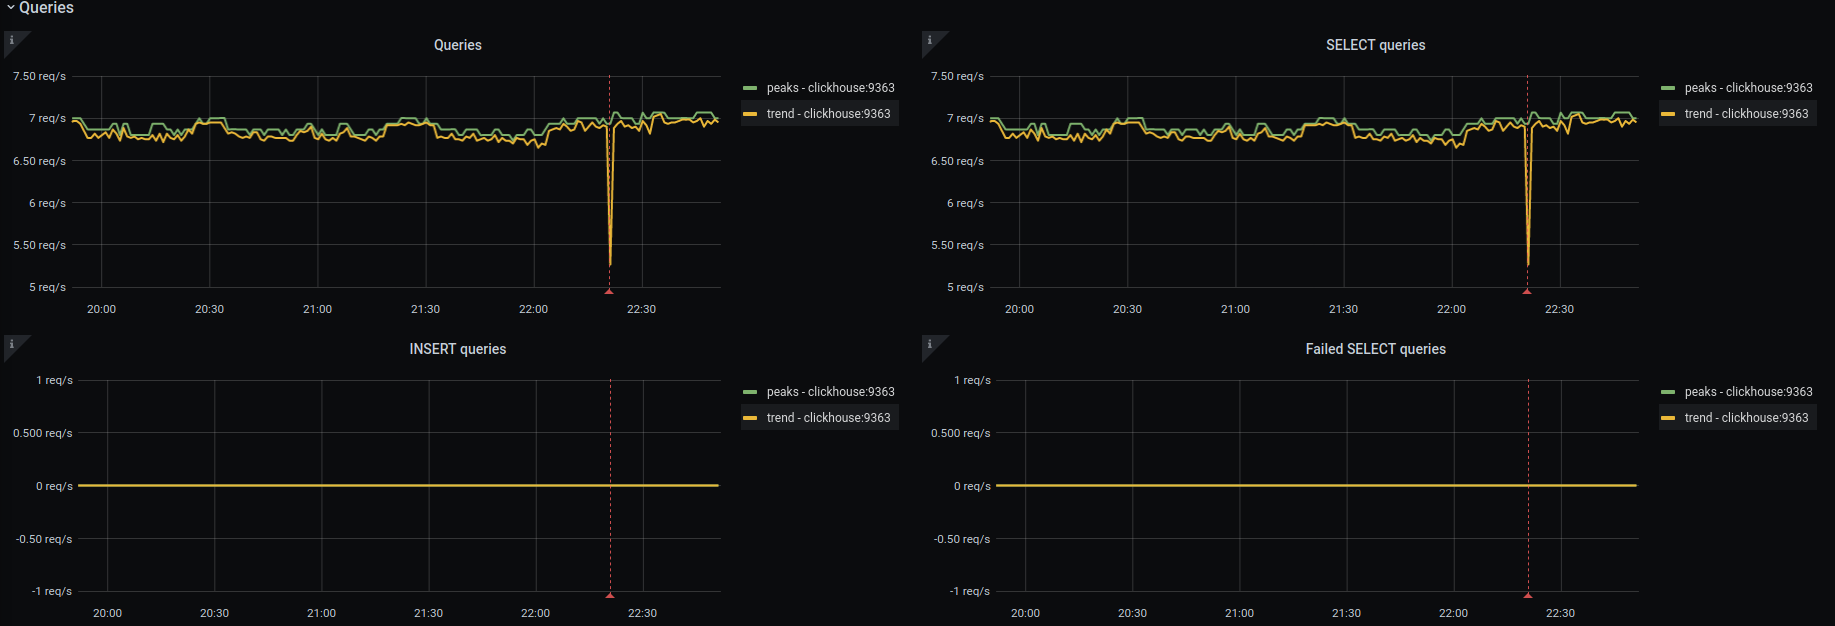
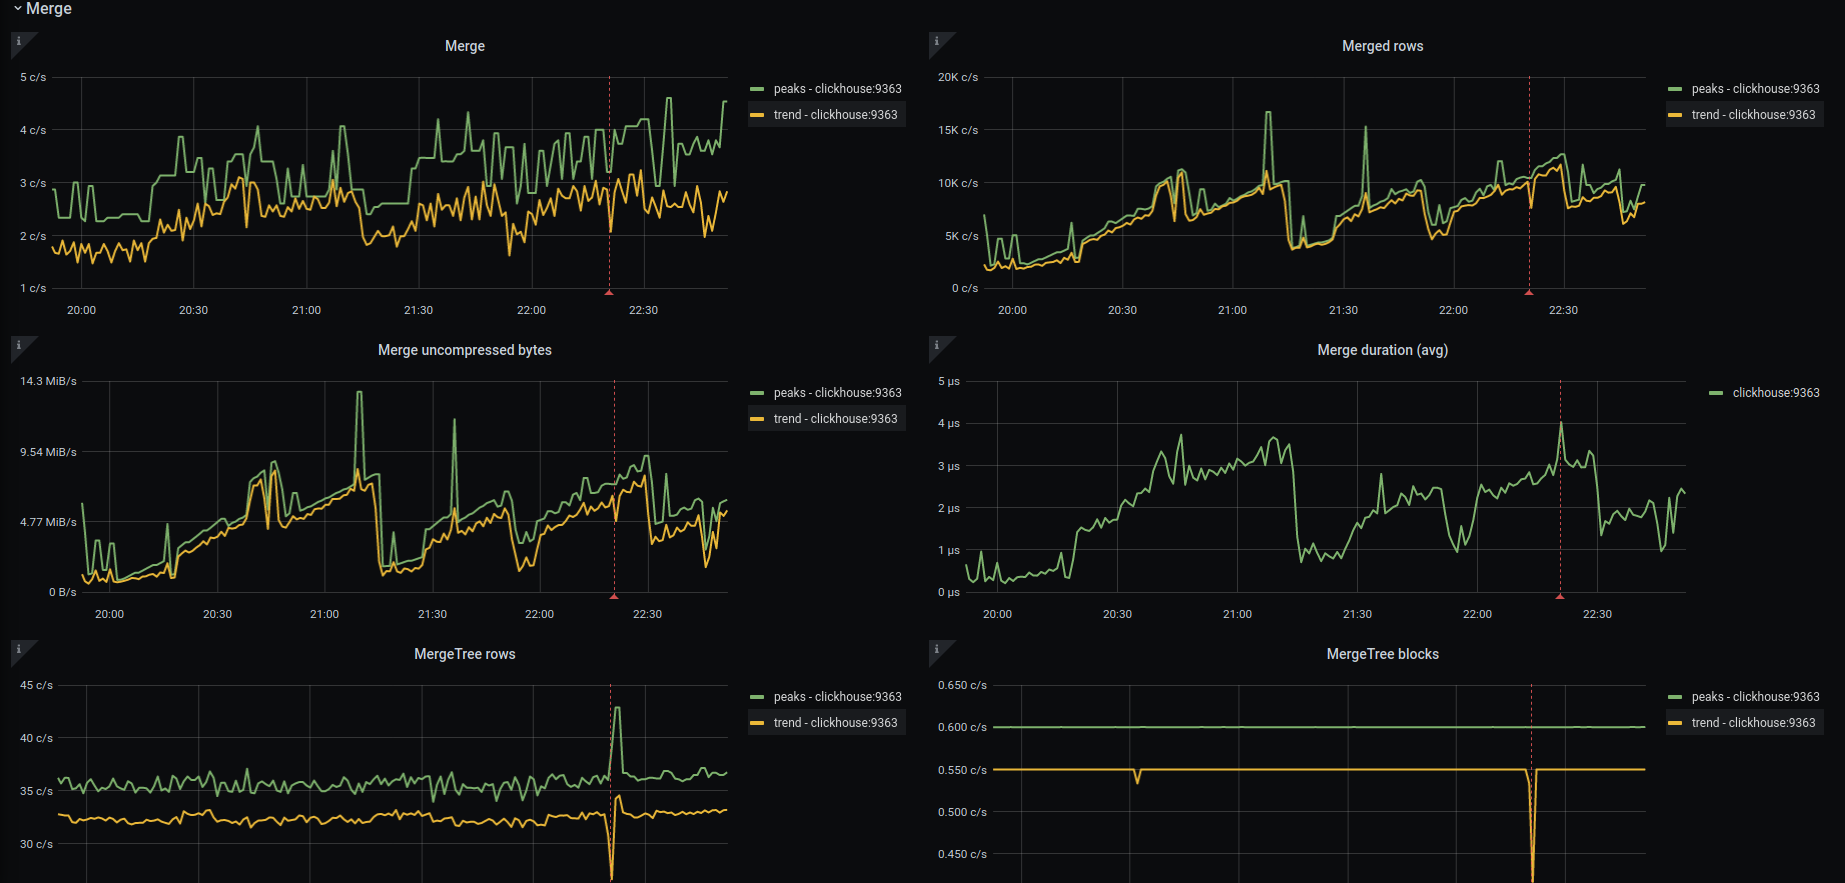
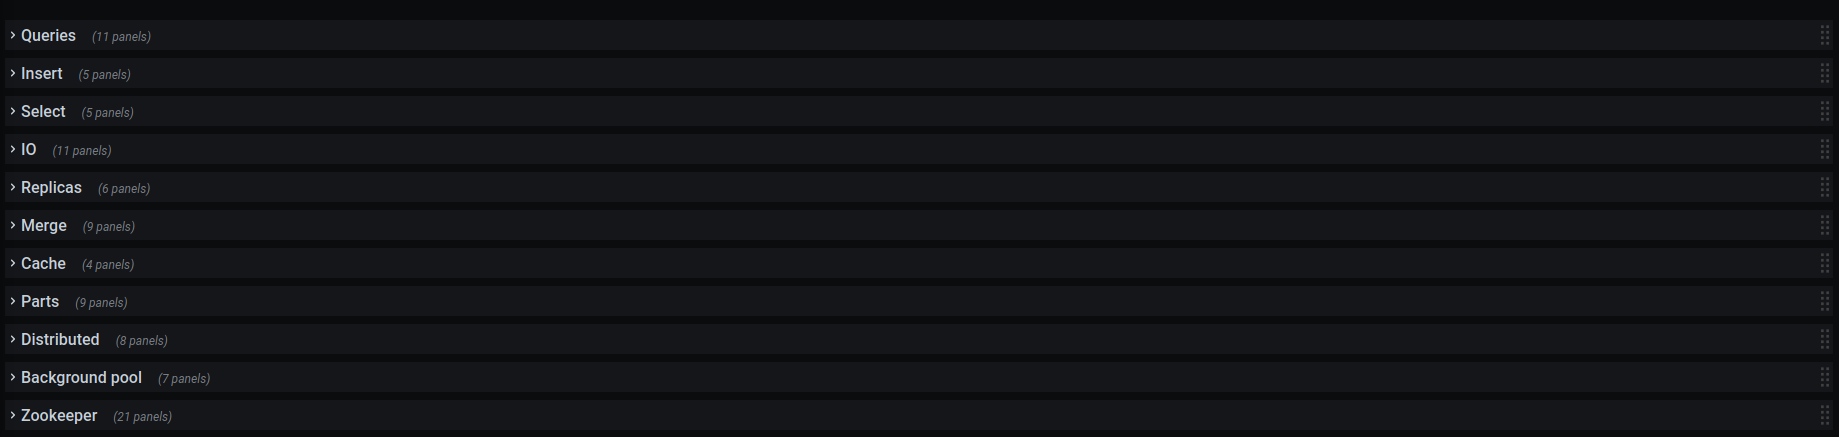
Screenshots
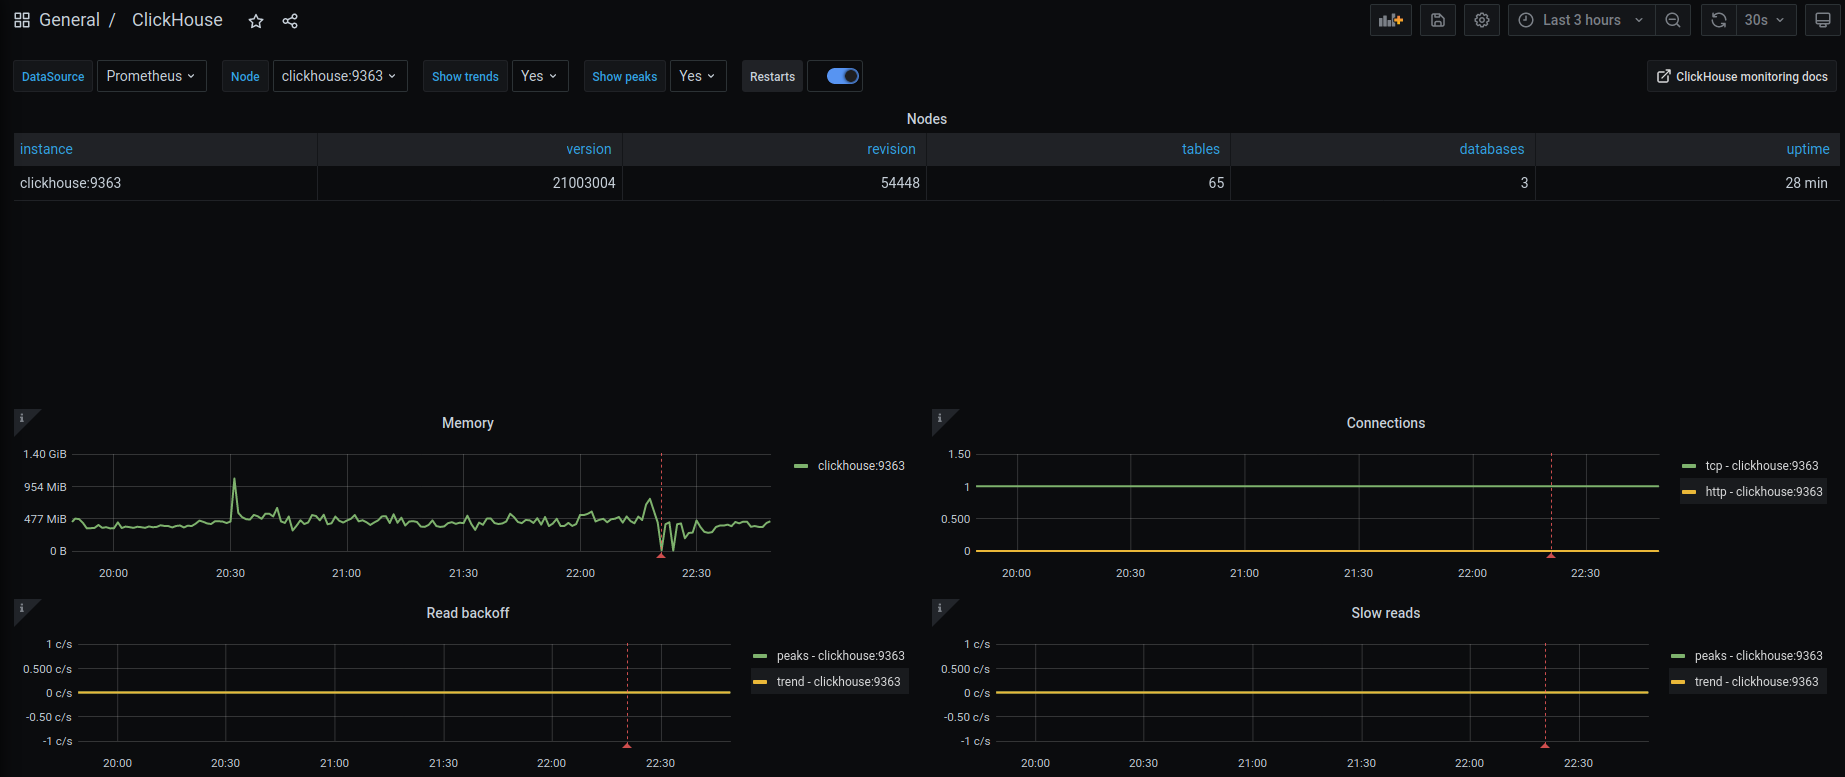
Used Metrics 1313
ClickHouseAsyncMetrics_NumberOfDatabases
ClickHouseAsyncMetrics_NumberOfTables
ClickHouseAsyncMetrics_Uptime
ClickHouseMetrics_HTTPConnection
ClickHouseMetrics_MemoryTracking
ClickHouseMetrics_Revision
ClickHouseMetrics_TCPConnection
ClickHouseMetrics_VersionInteger
ClickHouseProfileEvents_ReadBackoff
ClickHouseProfileEvents_SlowRead
__rate_interval:
peaks
trends
Get Dashboard✕
Download
Copy to Clipboard