Cilium v1.9 Hubble Metrics 417,937417,937
Description
This dashboard monitors real-time Cilium v1.9 Hubble networking metrics, providing visibility into flows, drops, and protocol usage across the cluster. It highlights per-node flow processing, distribution of traffic types and protocols, and granular drop reasons, with notable focus on hubble_flows_processed_total, hubble_drop_total, and hubble_port_distribution_total to quantify throughput, reliability, and port-level activity across both IPv4 and IPv6. Key features include top-k analyses for ports and pods, distribution charts for L7 and trace flows, and missing-SYN-ACK indicators for TCP and ICMP to help diagnose connectivity issues.
Screenshots
Used Metrics 1212
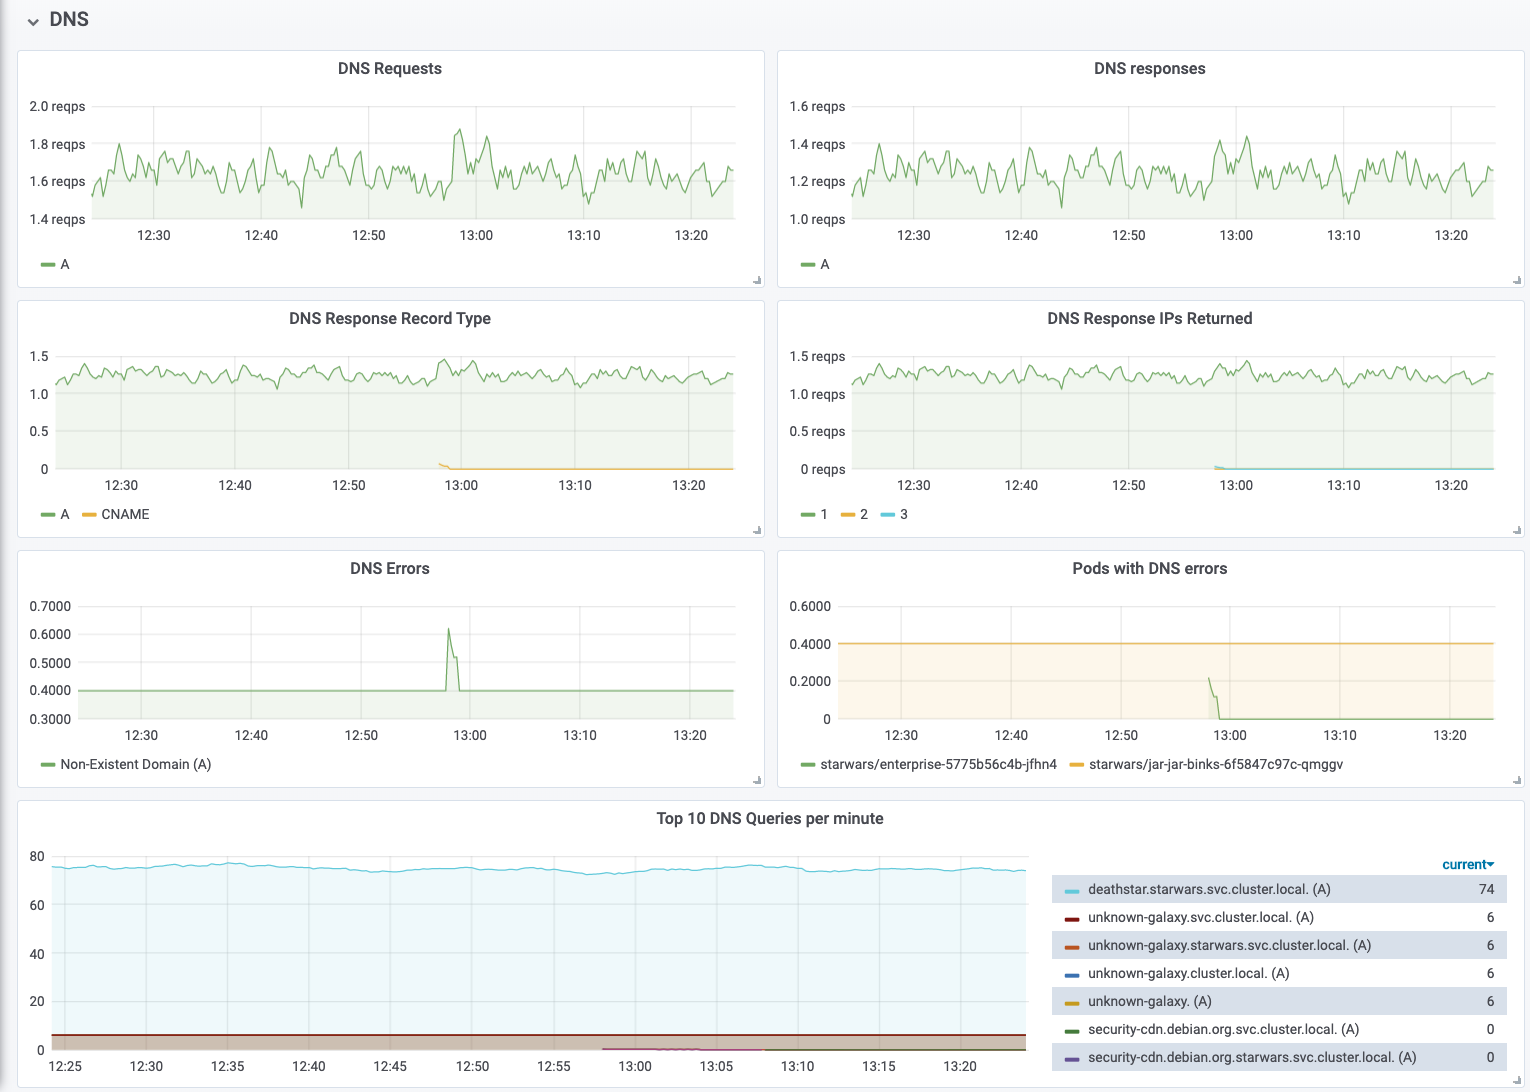
hubble_dns_queries_total
hubble_dns_response_types_total
hubble_dns_responses_total
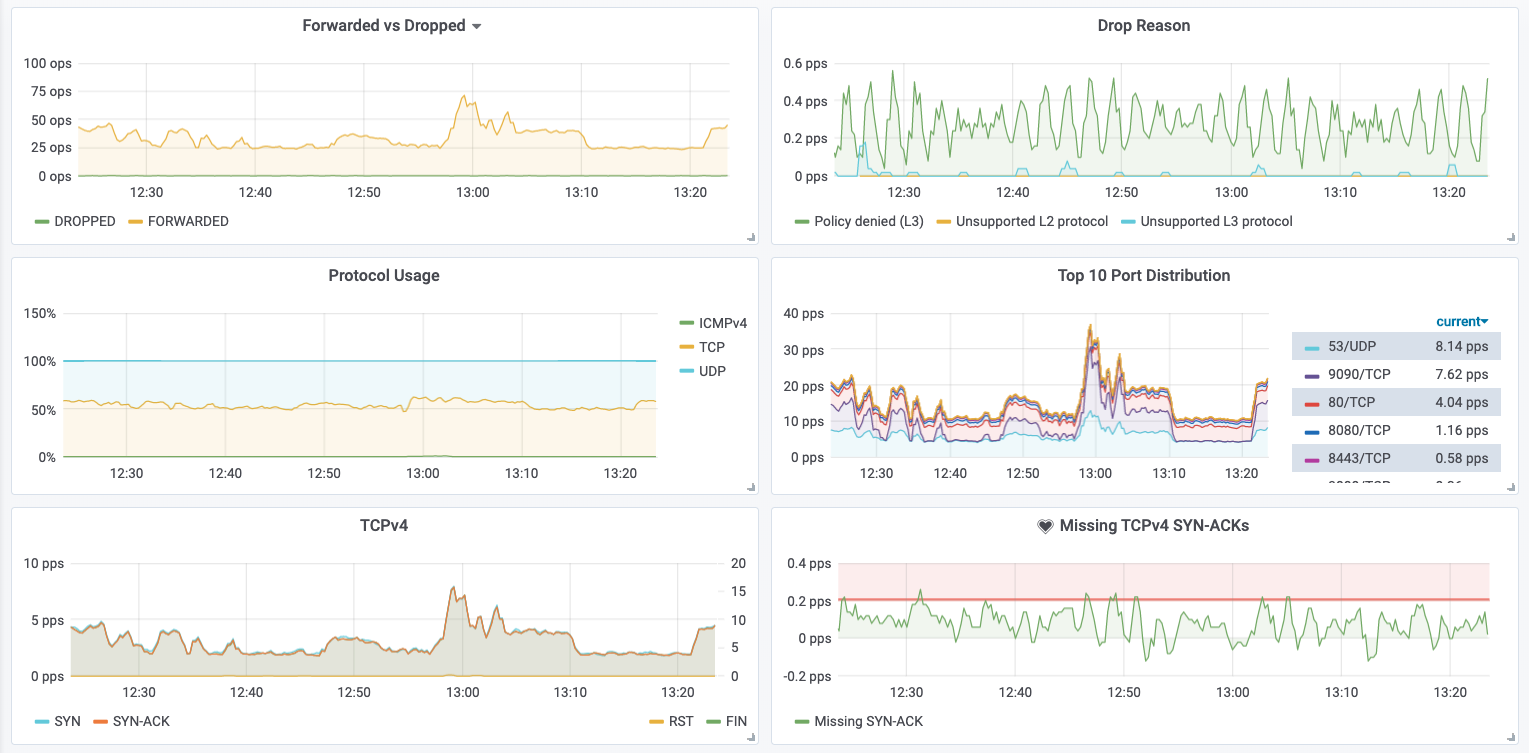
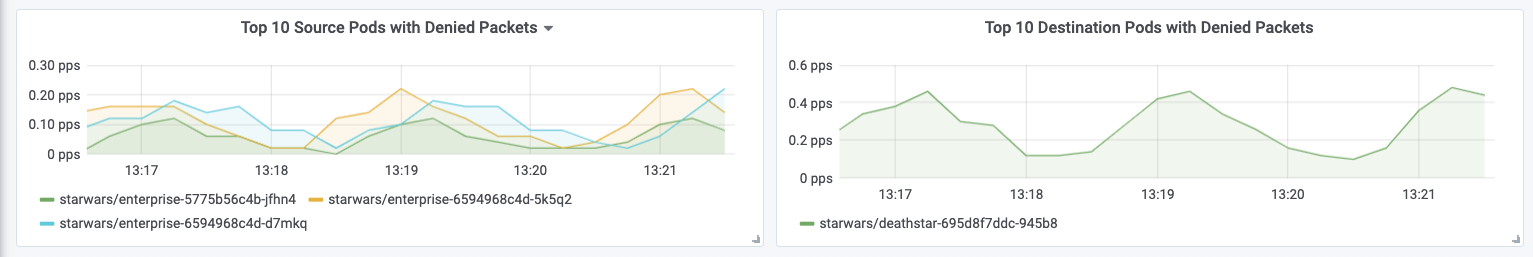
hubble_drop_total
hubble_flows_processed_total
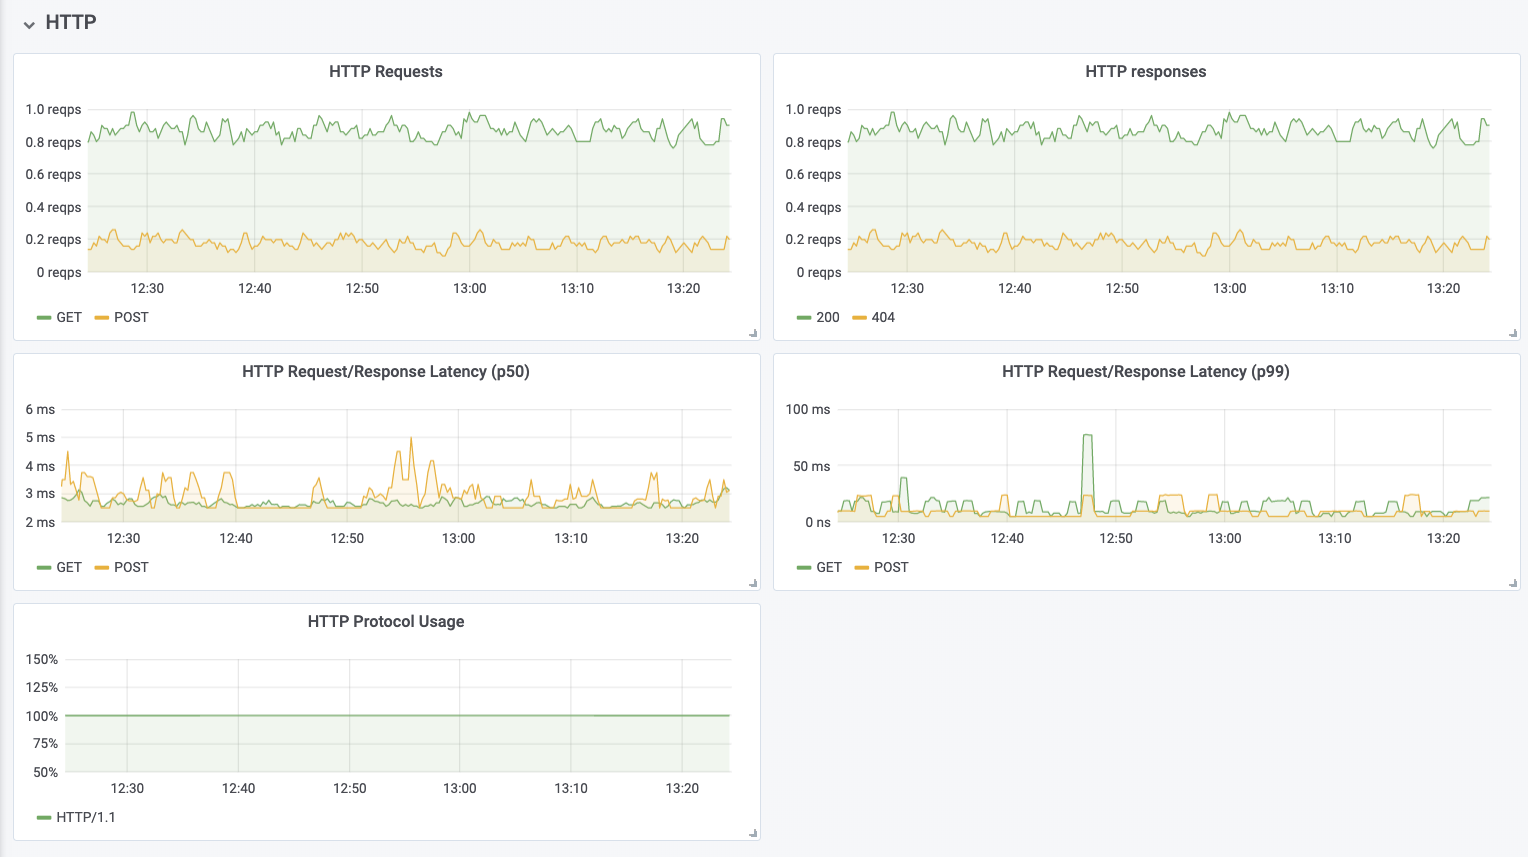
hubble_http_request_duration_seconds_bucket
hubble_http_requests_total
hubble_http_responses_total
hubble_icmp_total
hubble_port_distribution_total
hubble_tcp_flags_total
topk