Cilium v1.12 Hubble Metrics 553,733553,733
Description
This dashboard monitors mesh traffic and policy enforcement metrics from Cilium v1.12, providing insights into how flows are processed and where they are dropped or denied. It highlights per-node flow throughput, protocol distribution, and denied packets by reason, enabling rapid pinpointing of bottlenecks and policy violations. Key metrics include hubble_flows_processed_total, hubble_drop_total, and hubble_port_distribution_total to track volume, causes of drops, and the distribution of port usage across the mesh.
Screenshots
Used Metrics 1212
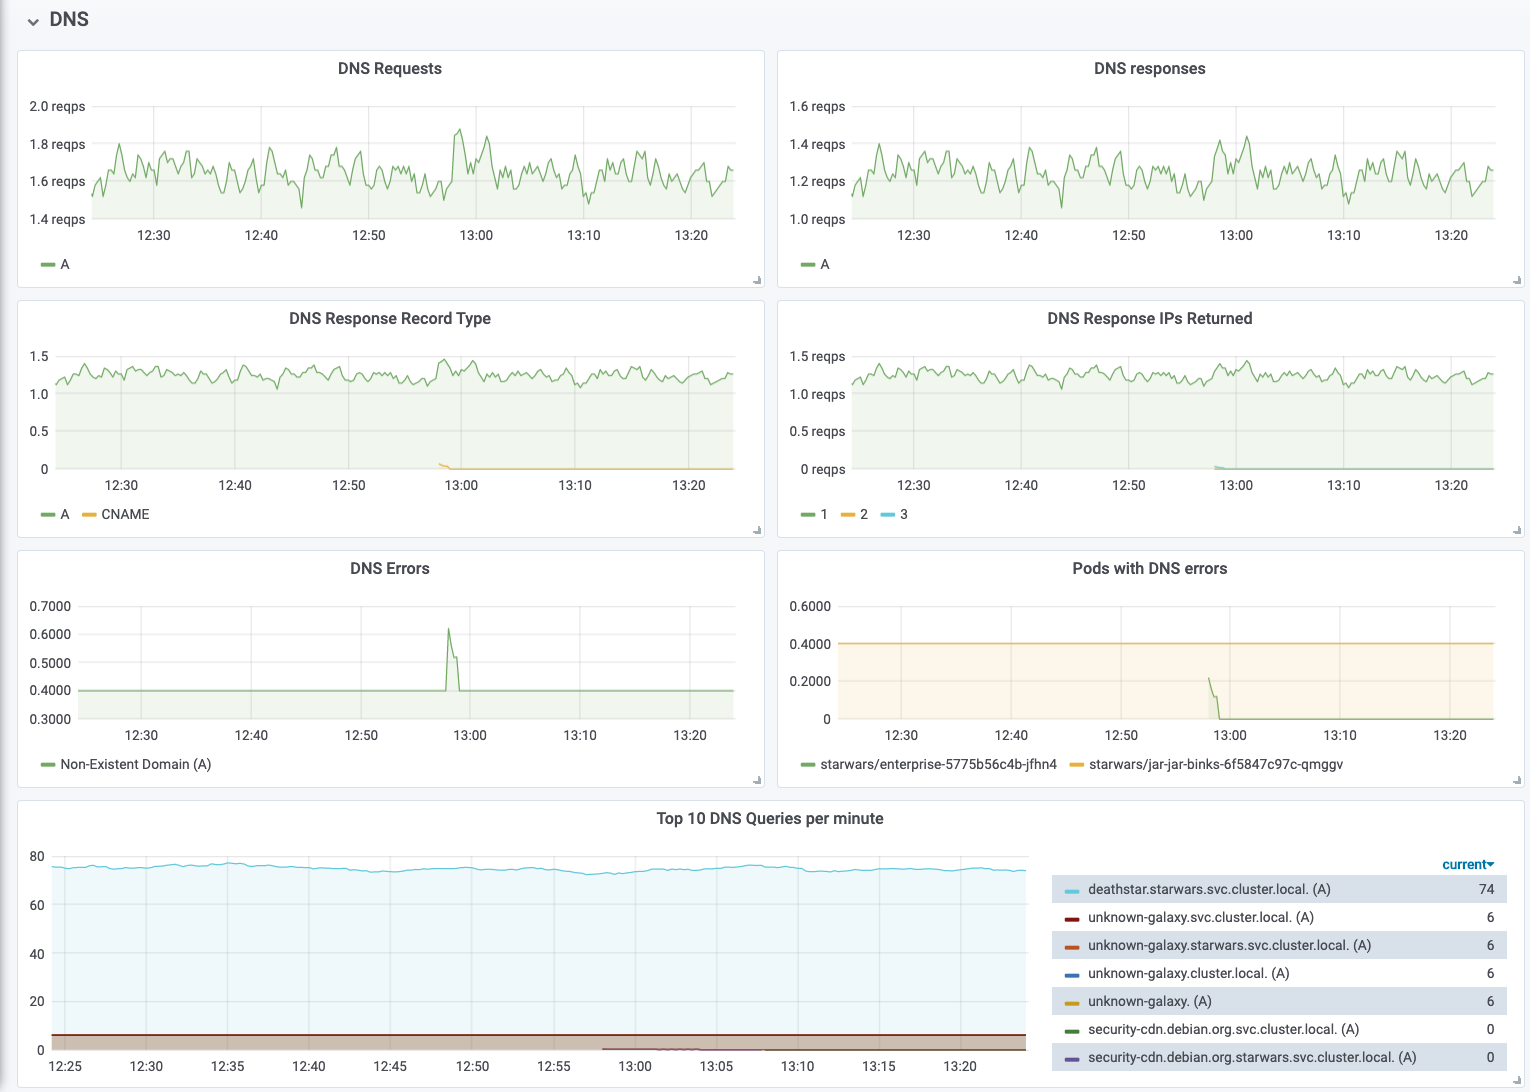
hubble_dns_queries_total
hubble_dns_response_types_total
hubble_dns_responses_total
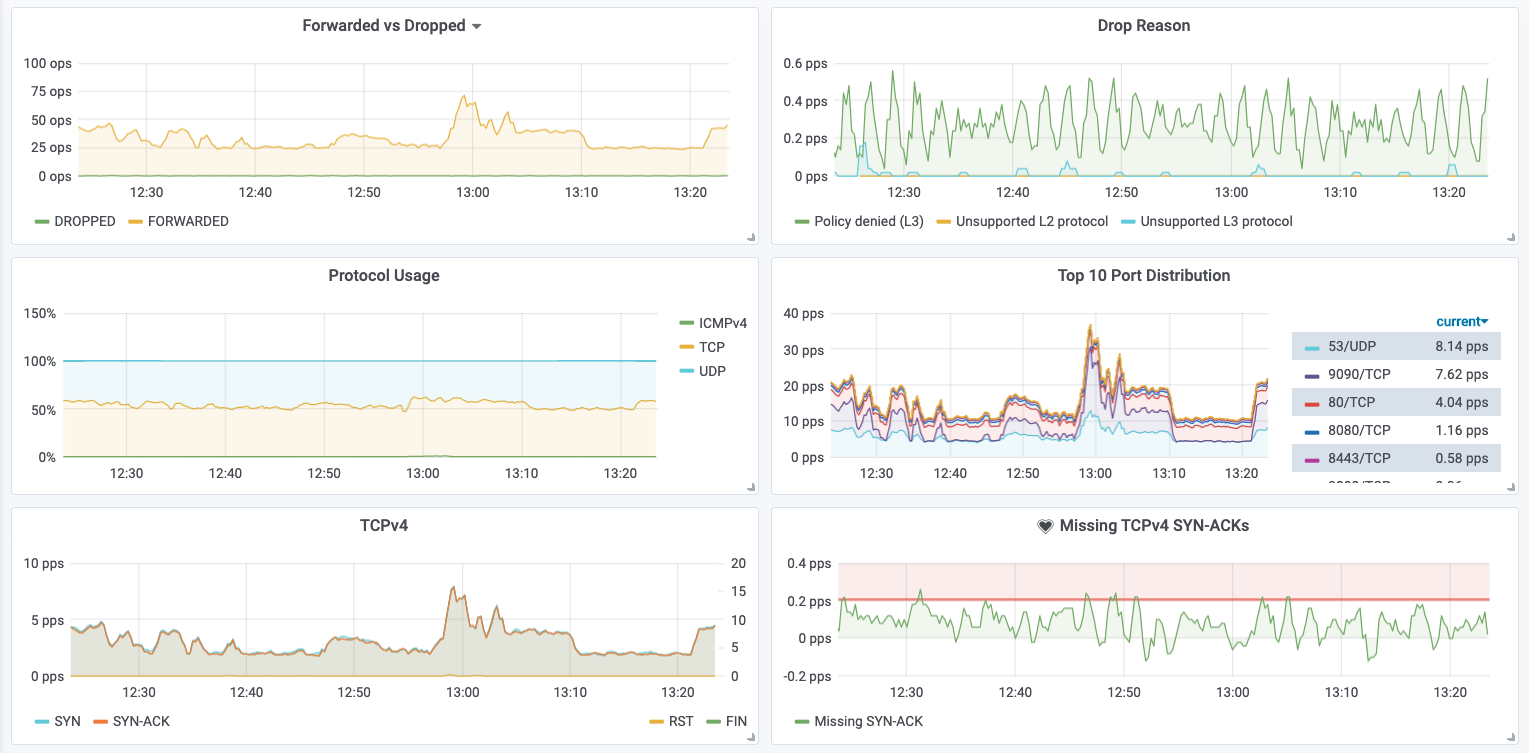
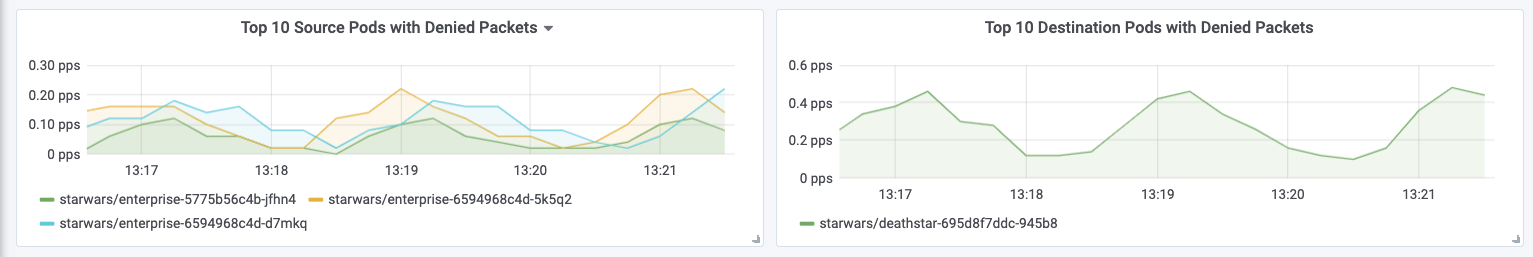
hubble_drop_total
hubble_flows_processed_total
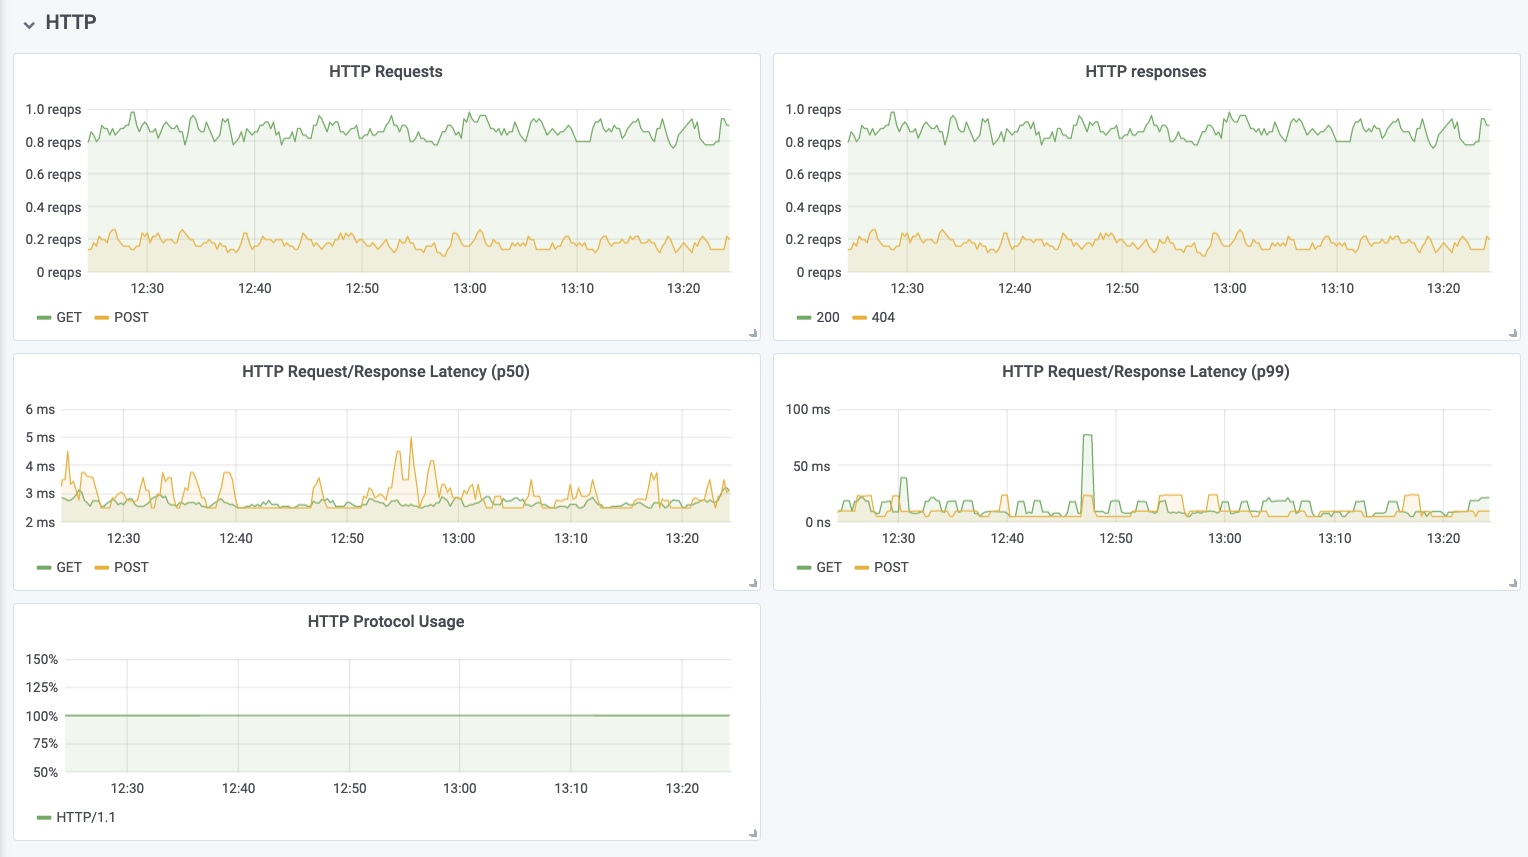
hubble_http_request_duration_seconds_bucket
hubble_http_requests_total
hubble_http_responses_total
hubble_icmp_total
hubble_port_distribution_total
hubble_tcp_flags_total
topk