Cilium v1.11 Hubble Metrics 797,675797,675
Description
This dashboard monitors Cilium v1.11 metrics to track network flows, policy enforcement, and protocol usage across a cluster. It highlights flow throughput and drop patterns with panels like hubble_flows_processed_total and hubble_drop_total, detailed protocol/port distribution via hubble_port_distribution_total and top-k summaries, and connection quality signals through TCP/ICMP metrics and HTTP request traces to surface denial reasons and missing handshake events.
Screenshots
Used Metrics 1212
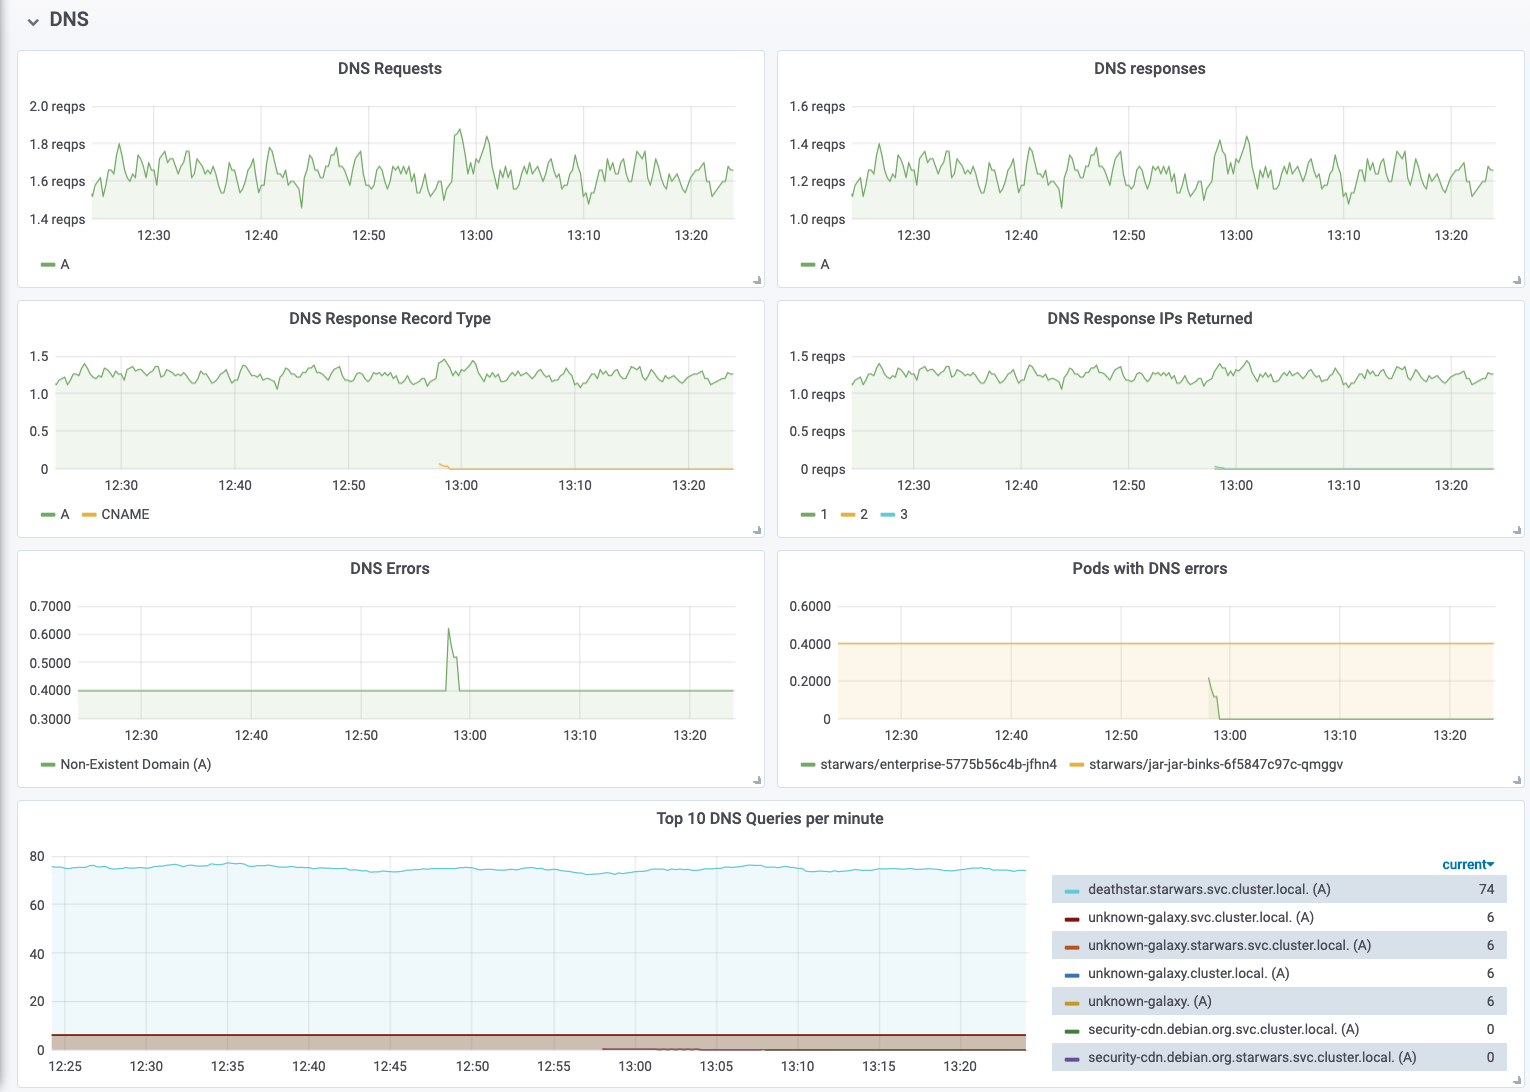
hubble_dns_queries_total
hubble_dns_response_types_total
hubble_dns_responses_total
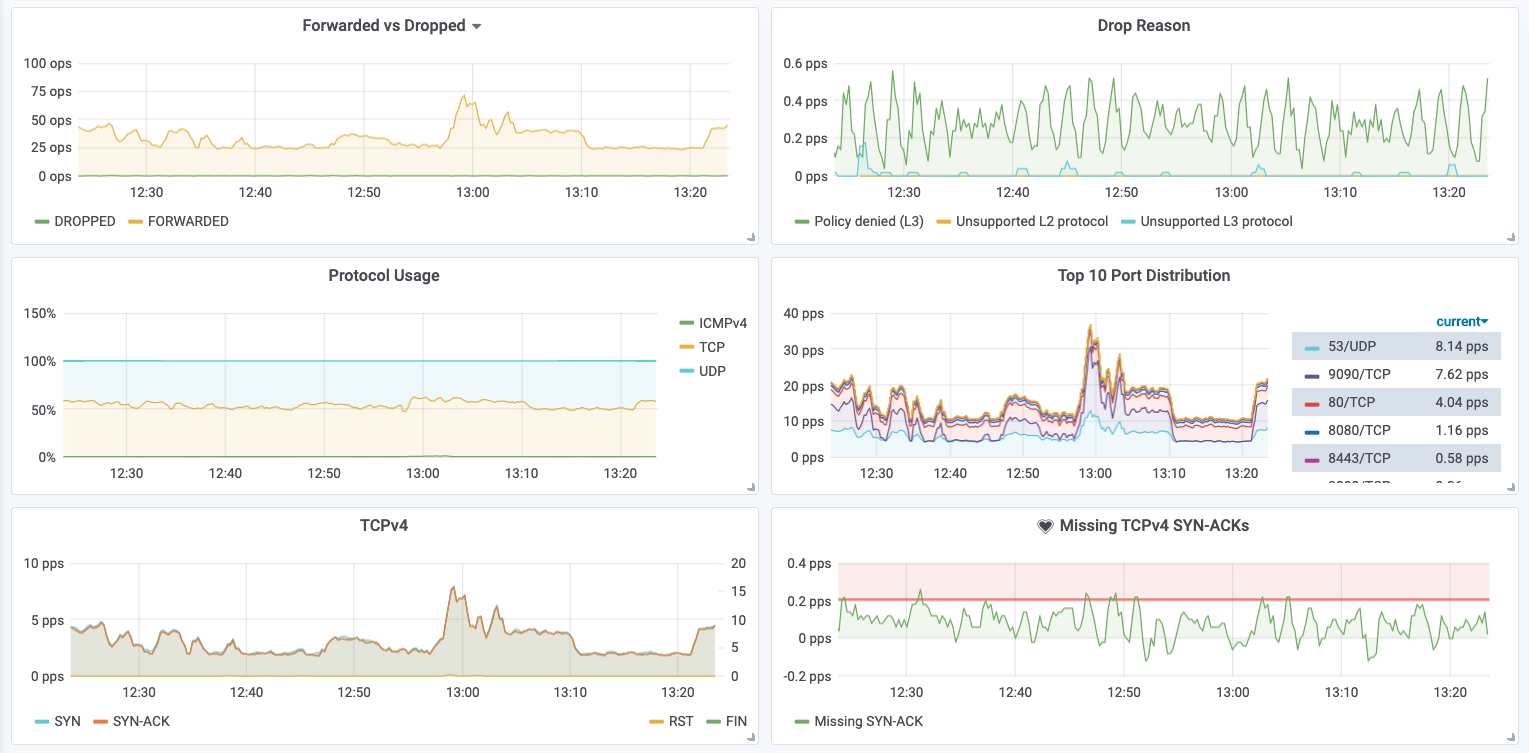
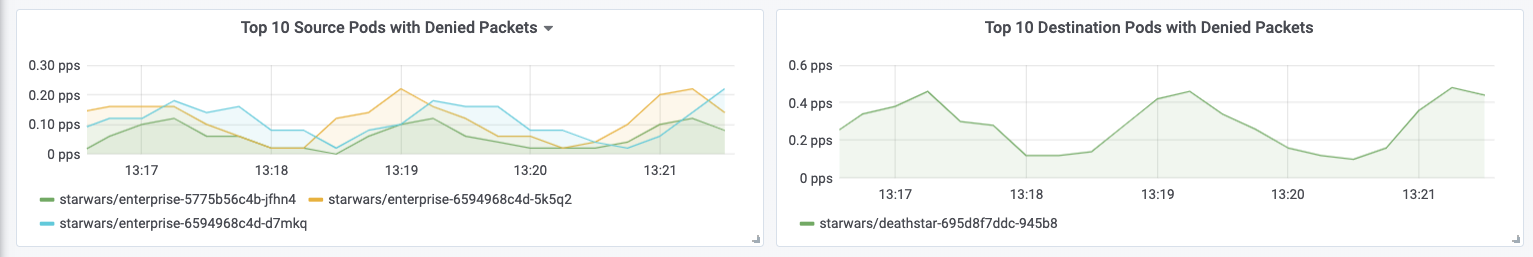
hubble_drop_total
hubble_flows_processed_total
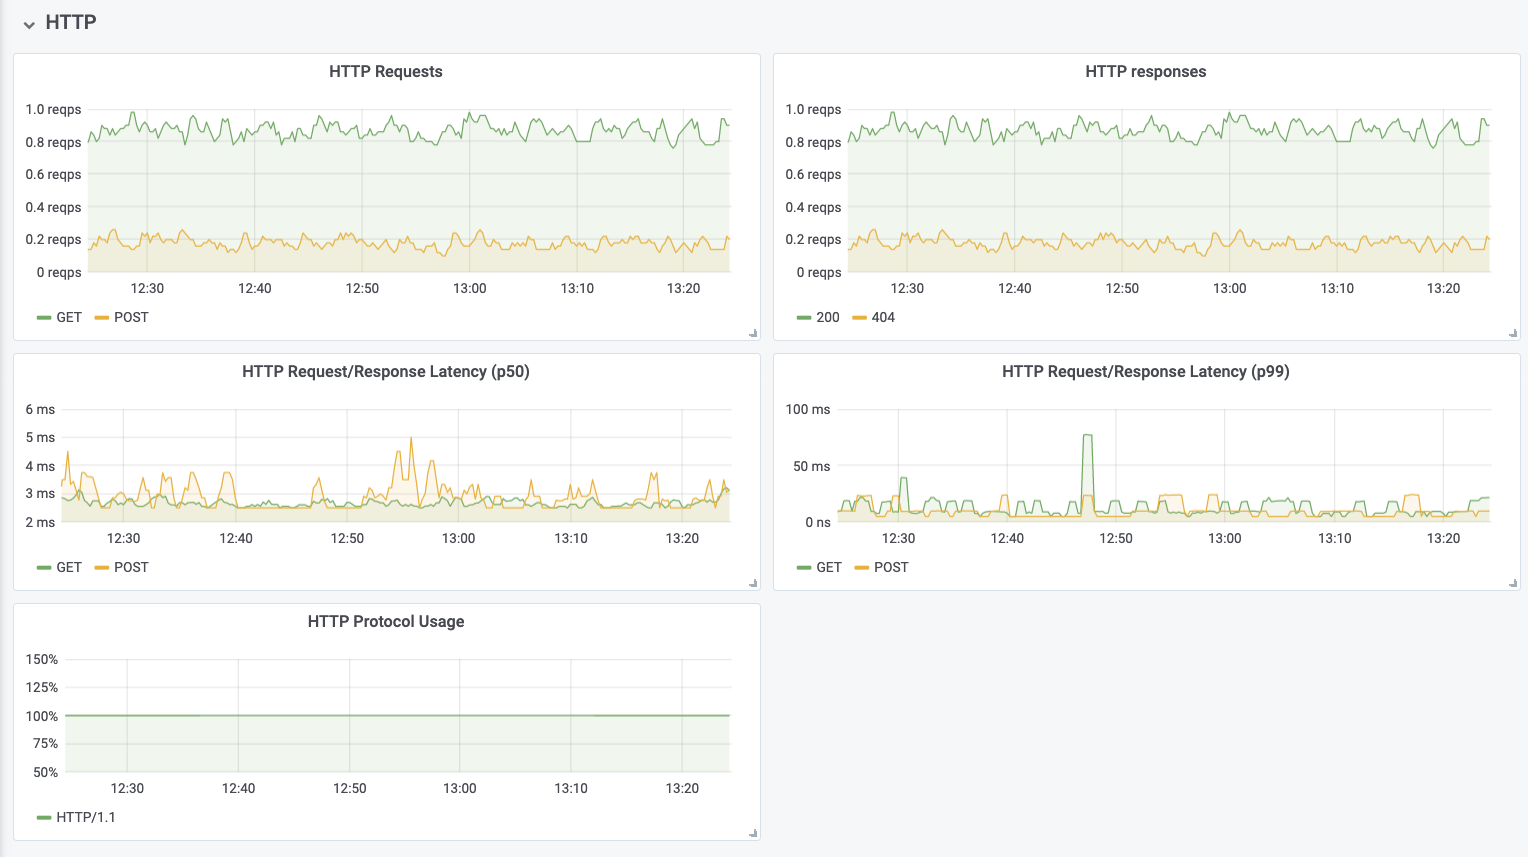
hubble_http_request_duration_seconds_bucket
hubble_http_requests_total
hubble_http_responses_total
hubble_icmp_total
hubble_port_distribution_total
hubble_tcp_flags_total
topk