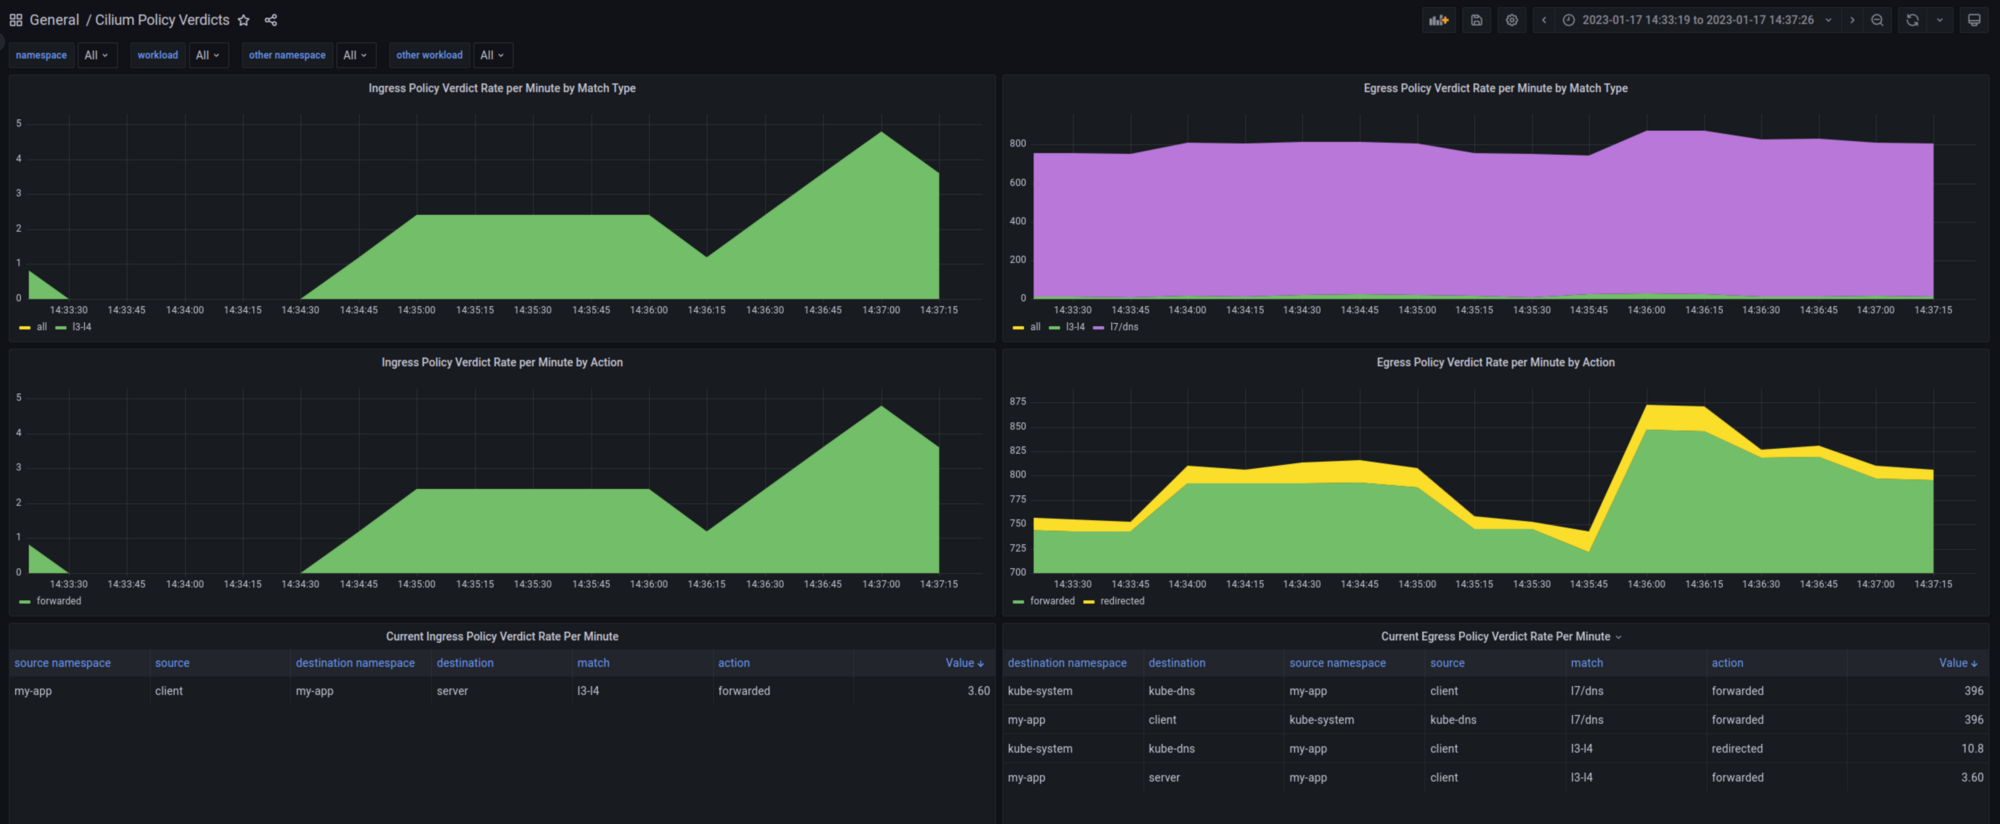
Cilium Policy Verdicts
23,477

Created 1/31/2023
Updated 4/18/2023
Revision 4
Grafana Version >=9.3.0
Datasources
Prometheus

Cilium Policy Verdicts Dashboard

This dashboard provides visibility on Network Policy application in a Cilium cluster.

Requirements

Cilium Version

This dashboard uses the hubble_policy_verdicts_total metrics, which was introduced in:

  • Isovalent Cilium Enterprise 1.12.0
  • Cilium OSS 1.13.0

Configuration

The hubble_policy_verdicts_total needs to be enabled in the Cilium metrics.

This can be achieved by using the policy metrics in hubble.metrics.enabled, for example using Helm values:

hubble:
  metrics:
    enabled:
      - "policy:sourceContext=app|workload-name|pod|reserved-identity;destinationContext=app|workload-name|pod|dns|reserved-identity;labelsContext=source_namespace,destination_namespace"

This example will enable policy metrics (you can add more metrics to that list). Additionally, it will configure the labels for the policy metric series to use:

  • app, workload-name, pod or reserved-identity for source flows
  • app, workload-name, pod, dns, or reserved-identity for destination flows
  • additional source_namespace and destination_namespace labels

The present Grafana dashboard is optimized for this context configuration (see documentation).

Get Dashboard
Download
Copy to Clipboard
Source Grafana.com

Used Metrics 1

  • hubble_policy_verdicts_total