Chirpstack/Metrics/Cluster 2,6252,625
10/29/2020
11/2/2020
2
Web Servers
>=7.2.1
Prometheus
Description
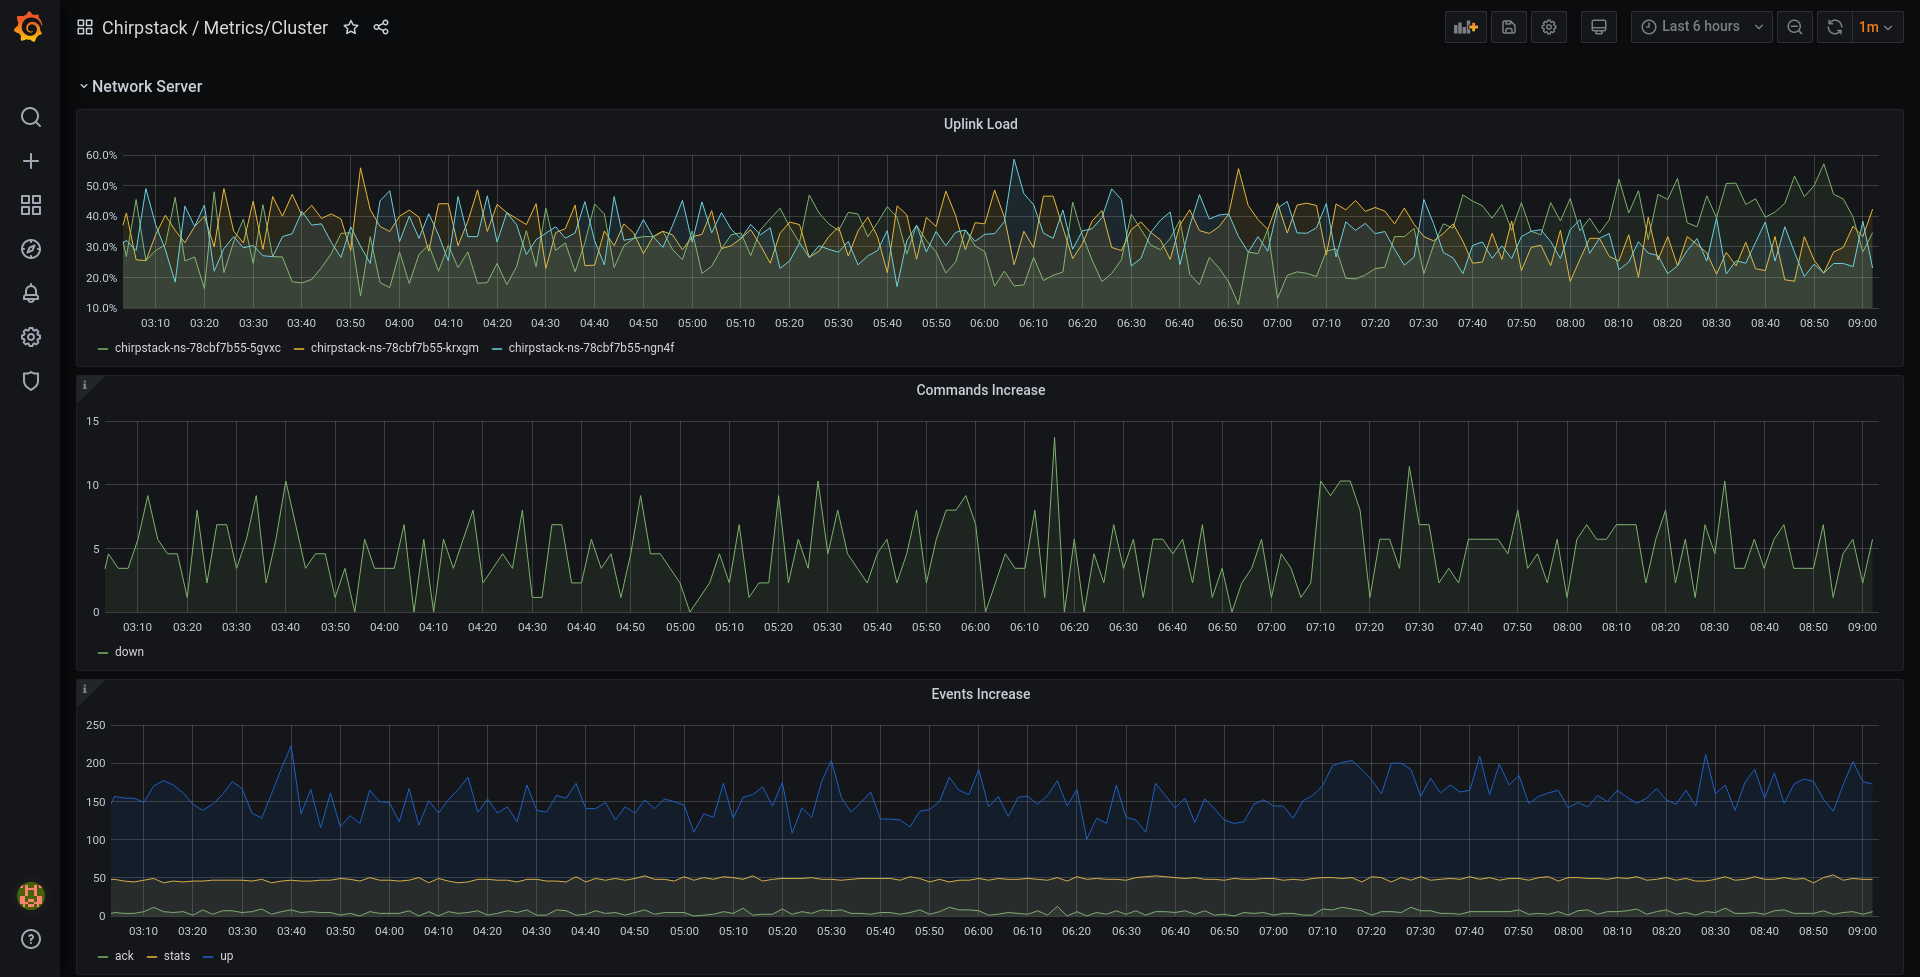
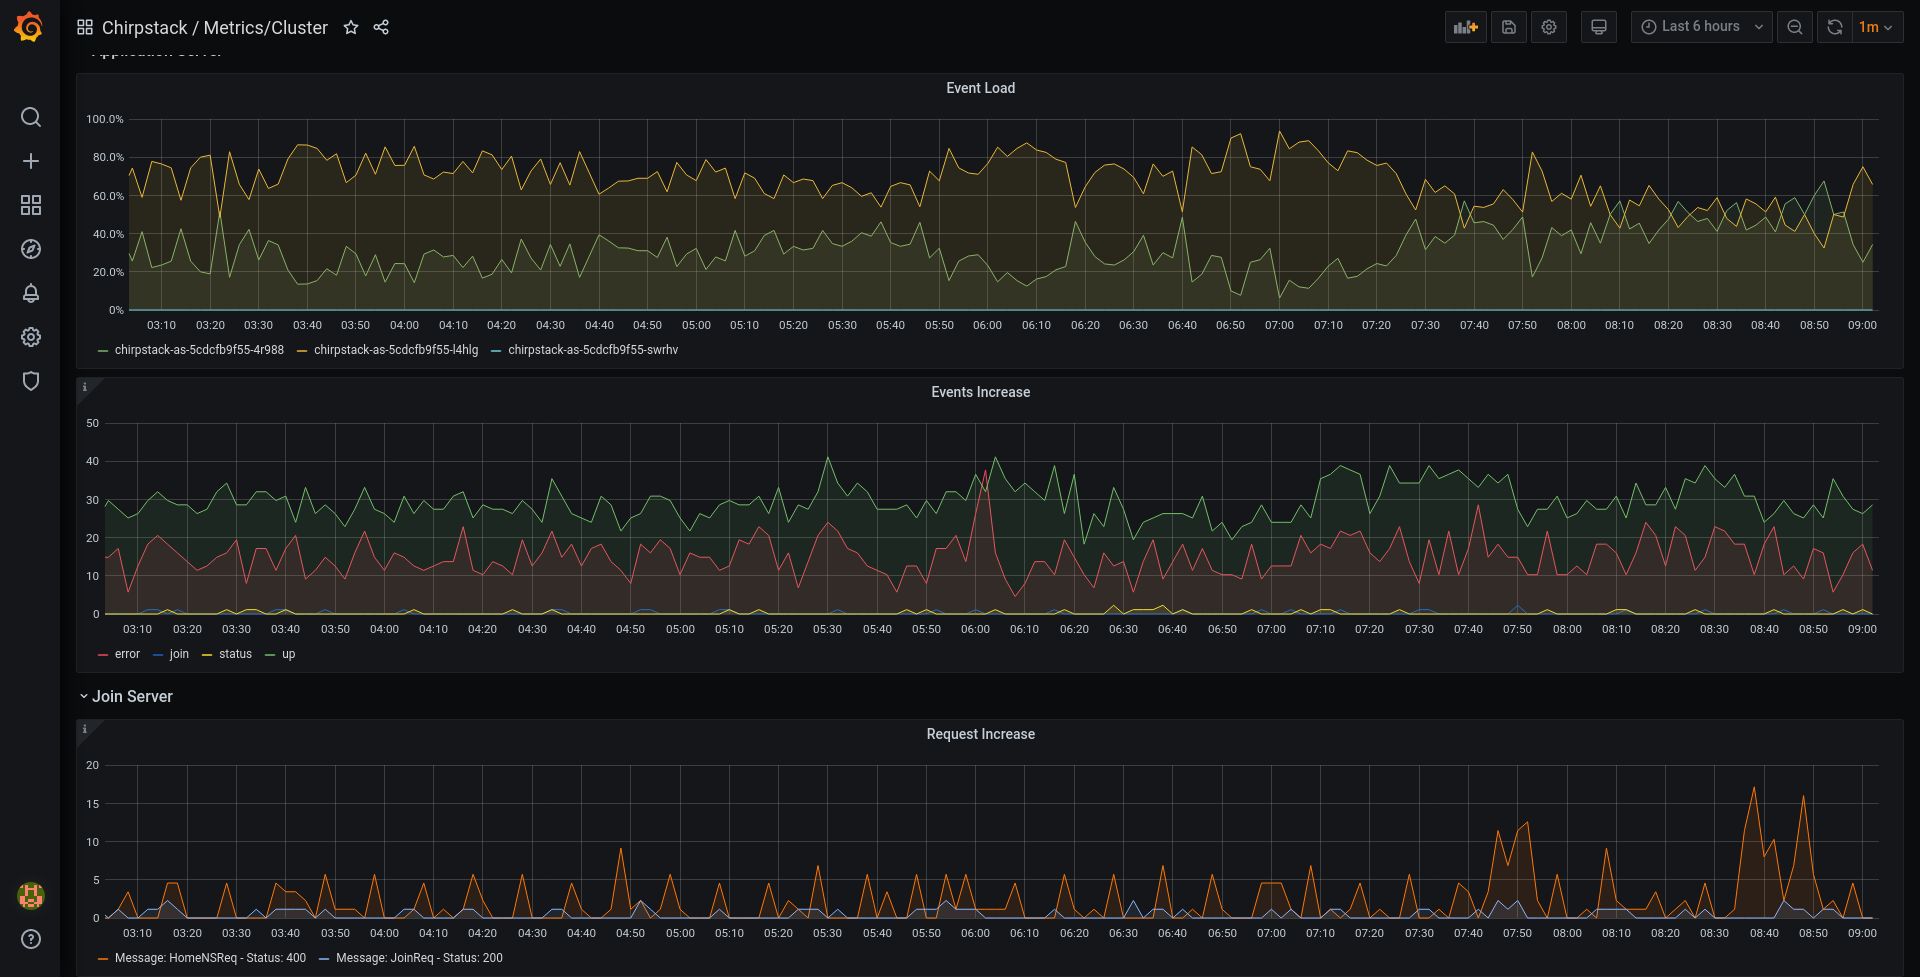
Displays metrics about the Chirpstack Network-Server, Application-Server and Join-Server
Screenshots
Used Metrics 55
api_joinserver_request_count
backend_mqtt_command_count
backend_mqtt_event_count
integration_mqtt_event_count
uplink_histogram_count
Get Dashboard✕
Download
Copy to Clipboard