cert-manager 3,518,4243,518,424
1/21/2024
1/21/2024
1
>=10.2.3
Prometheus
Description
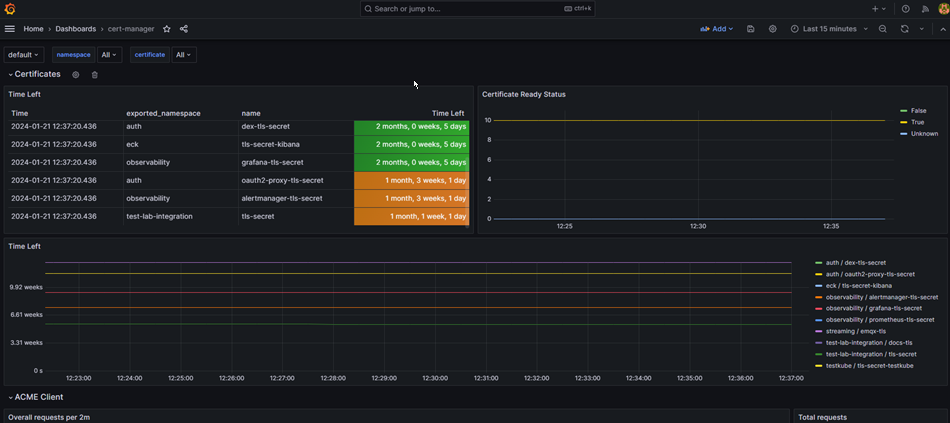
This dashboard monitors the health and lifecycle of TLS certificates and ACME interactions. It highlights certificate expirations via certmanager_certificate_expiration_timestamp_seconds, readiness status via certmanager_certificate_ready_status, and HTTP ACME client activity with certmanager_http_acme_client_request_count, offering both expiration awareness and operational request visibility through time-based panels like Time Left and Overall requests per 2m.
Screenshots
Used Metrics 33
certmanager_certificate_expiration_timestamp_seconds
certmanager_certificate_ready_status
certmanager_http_acme_client_request_count
Get Dashboard✕
Download
Copy to Clipboard