Ceph - Pools 1,328,7461,328,746
3/28/2018
1/9/2023
9
>=9.0.5
Description
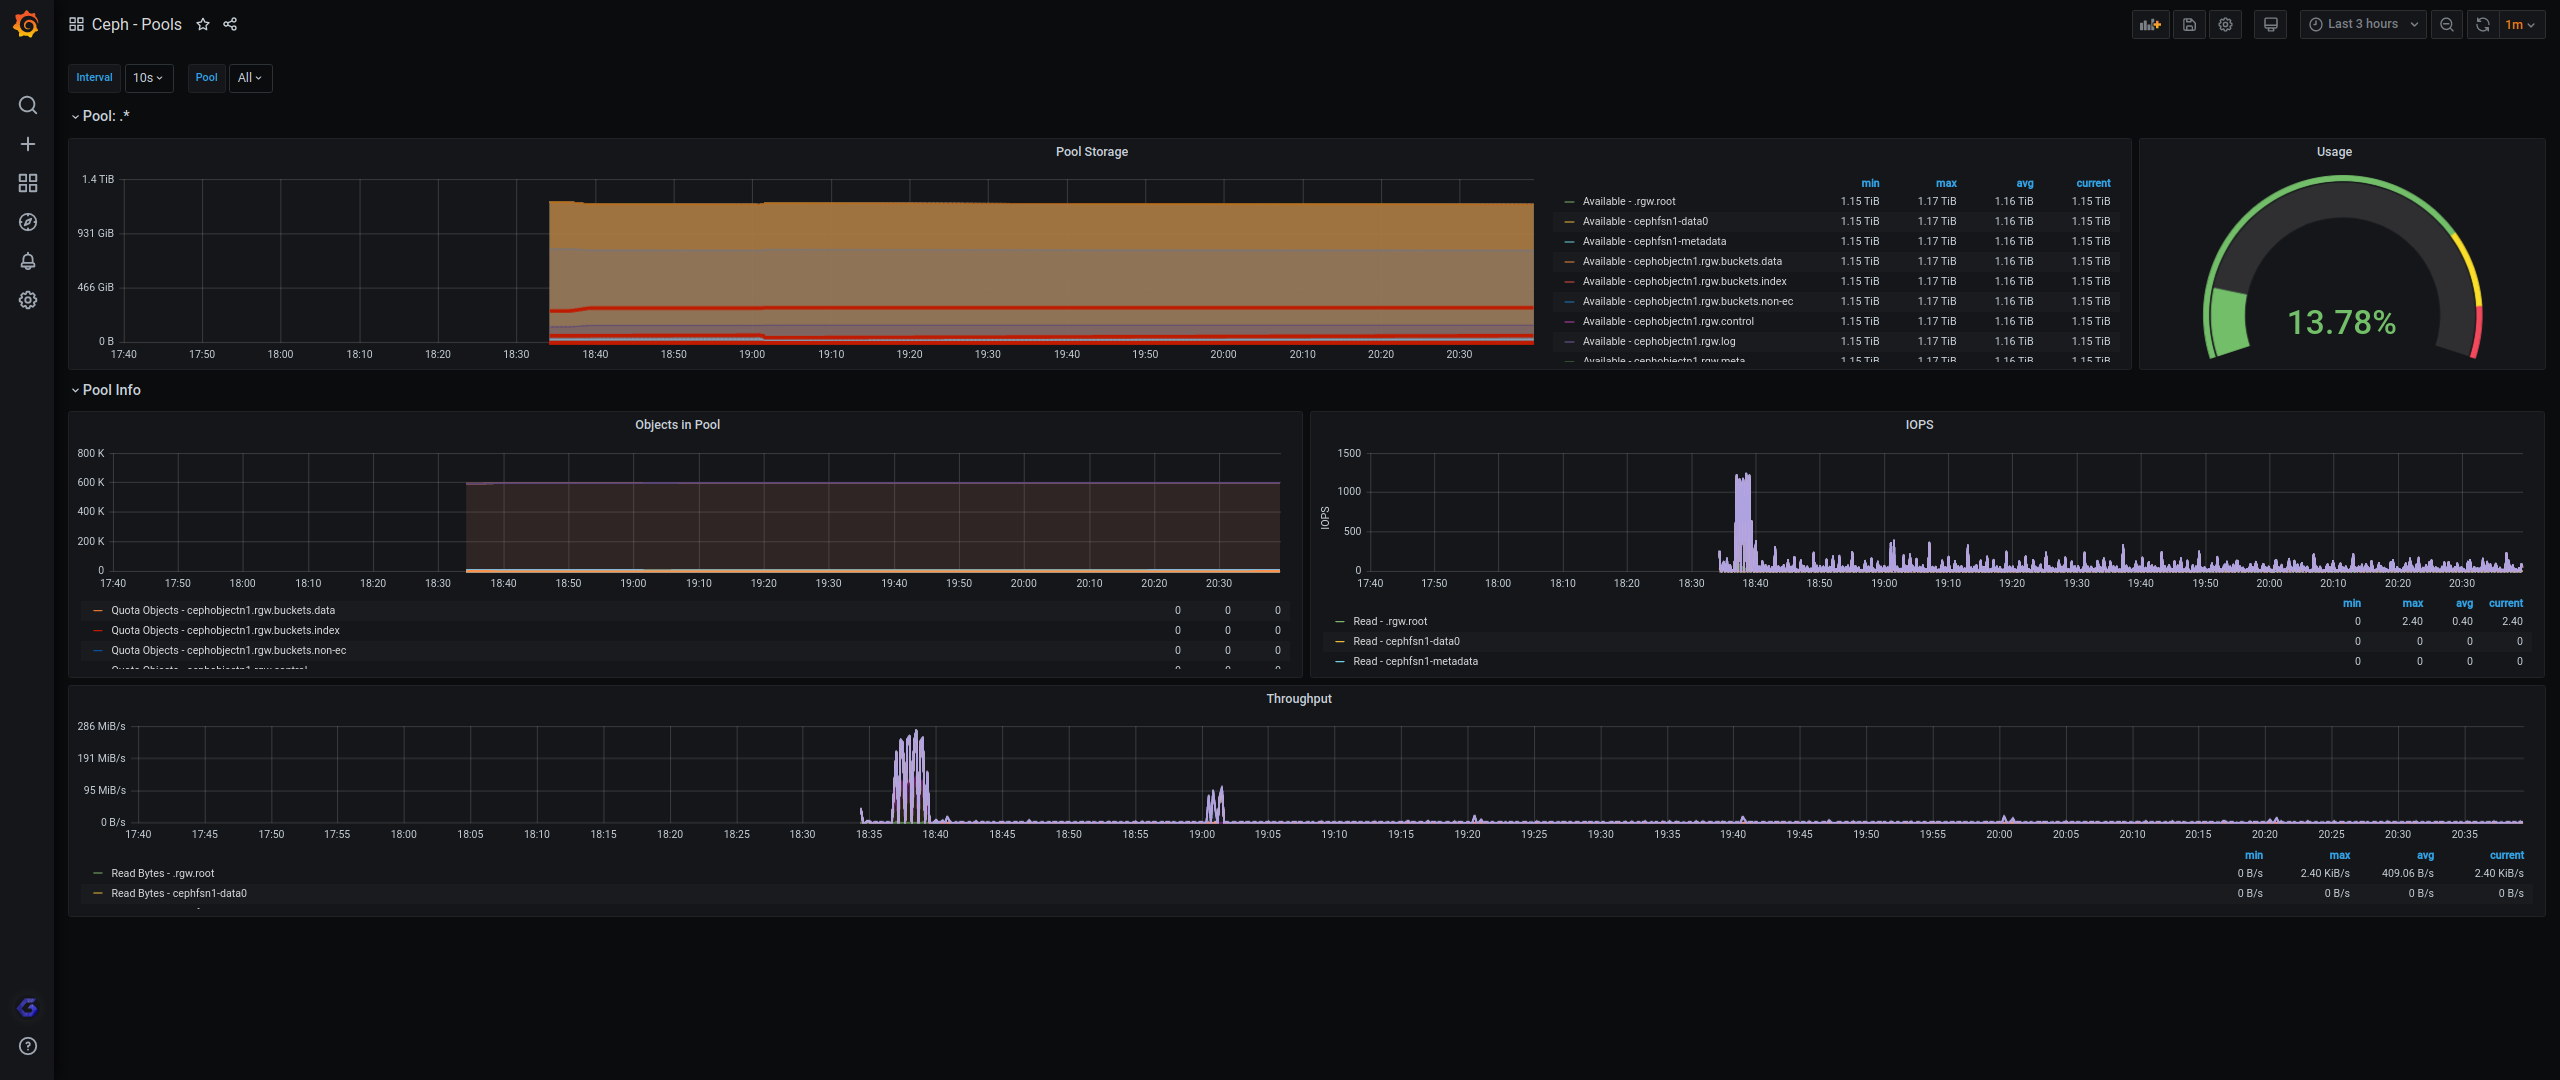
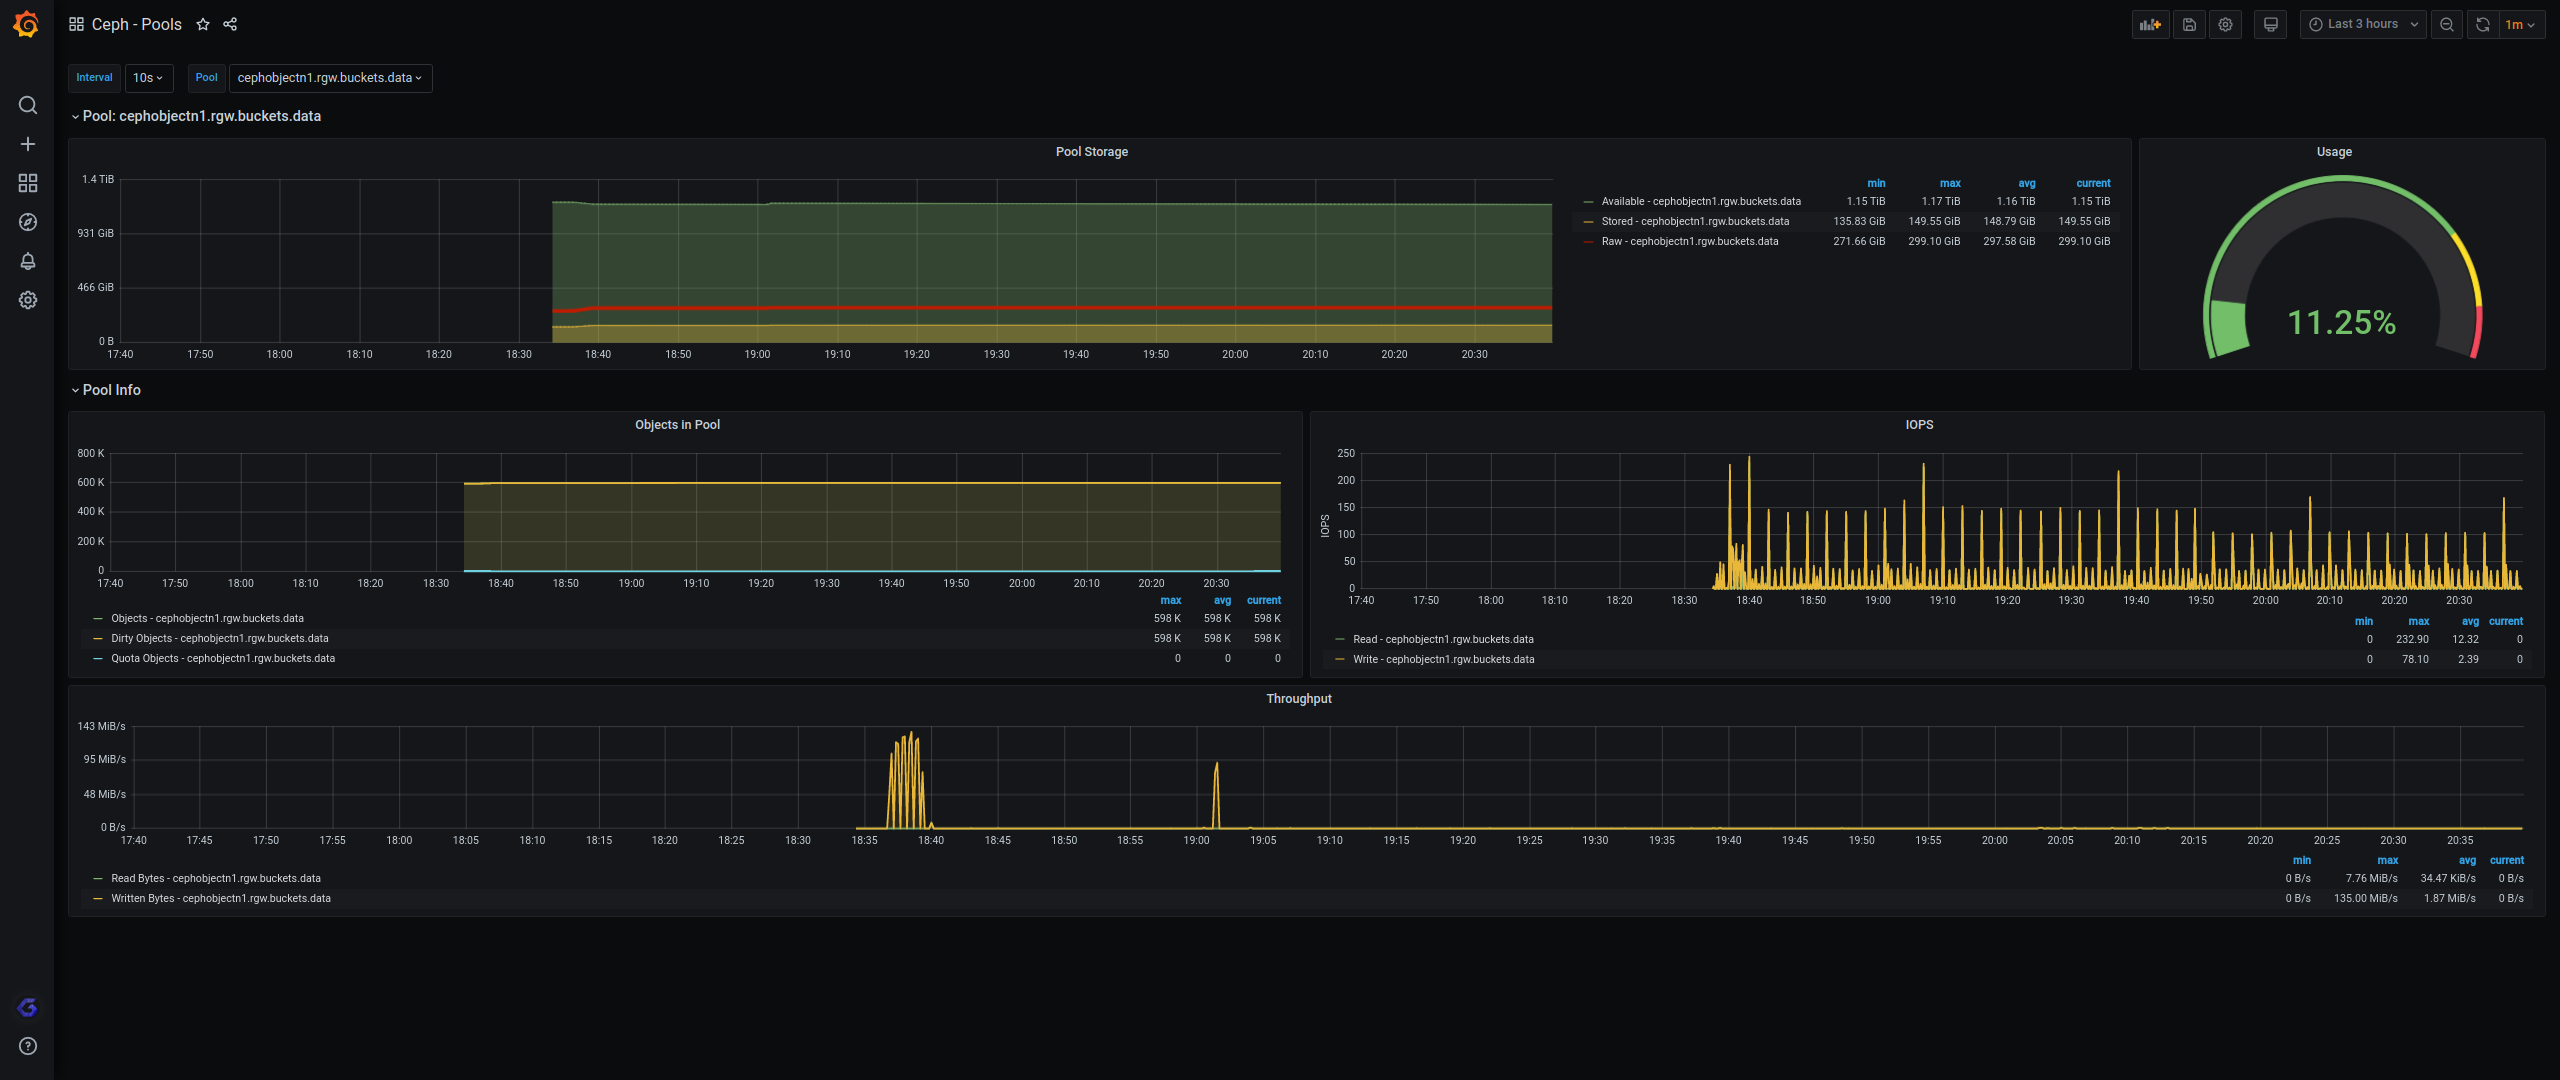
This dashboard monitors Ceph pool health and performance with panels that visualize per-pool storage, usage, and throughput metrics. It highlights key indicators such as ceph_pool_stored (storage usage), ceph_pool_max_avail (available capacity), and ceph_pool_rd/ceph_pool_wr (read/write IOPS) to assess capacity, I/O activity, and potential bottlenecks. Additional panels track objects in pools, metadata, and quota enforcement to provide deeper visibility into pool composition and governance.
Screenshots

Get Dashboard✕
Download
Copy to Clipboard