Celery Tasks Dashboard 1,0351,035 5.0 (1 reviews)
12/3/2023
12/3/2023
1
Host MetricsWeb Servers
>=10.2.2
Prometheus
Description
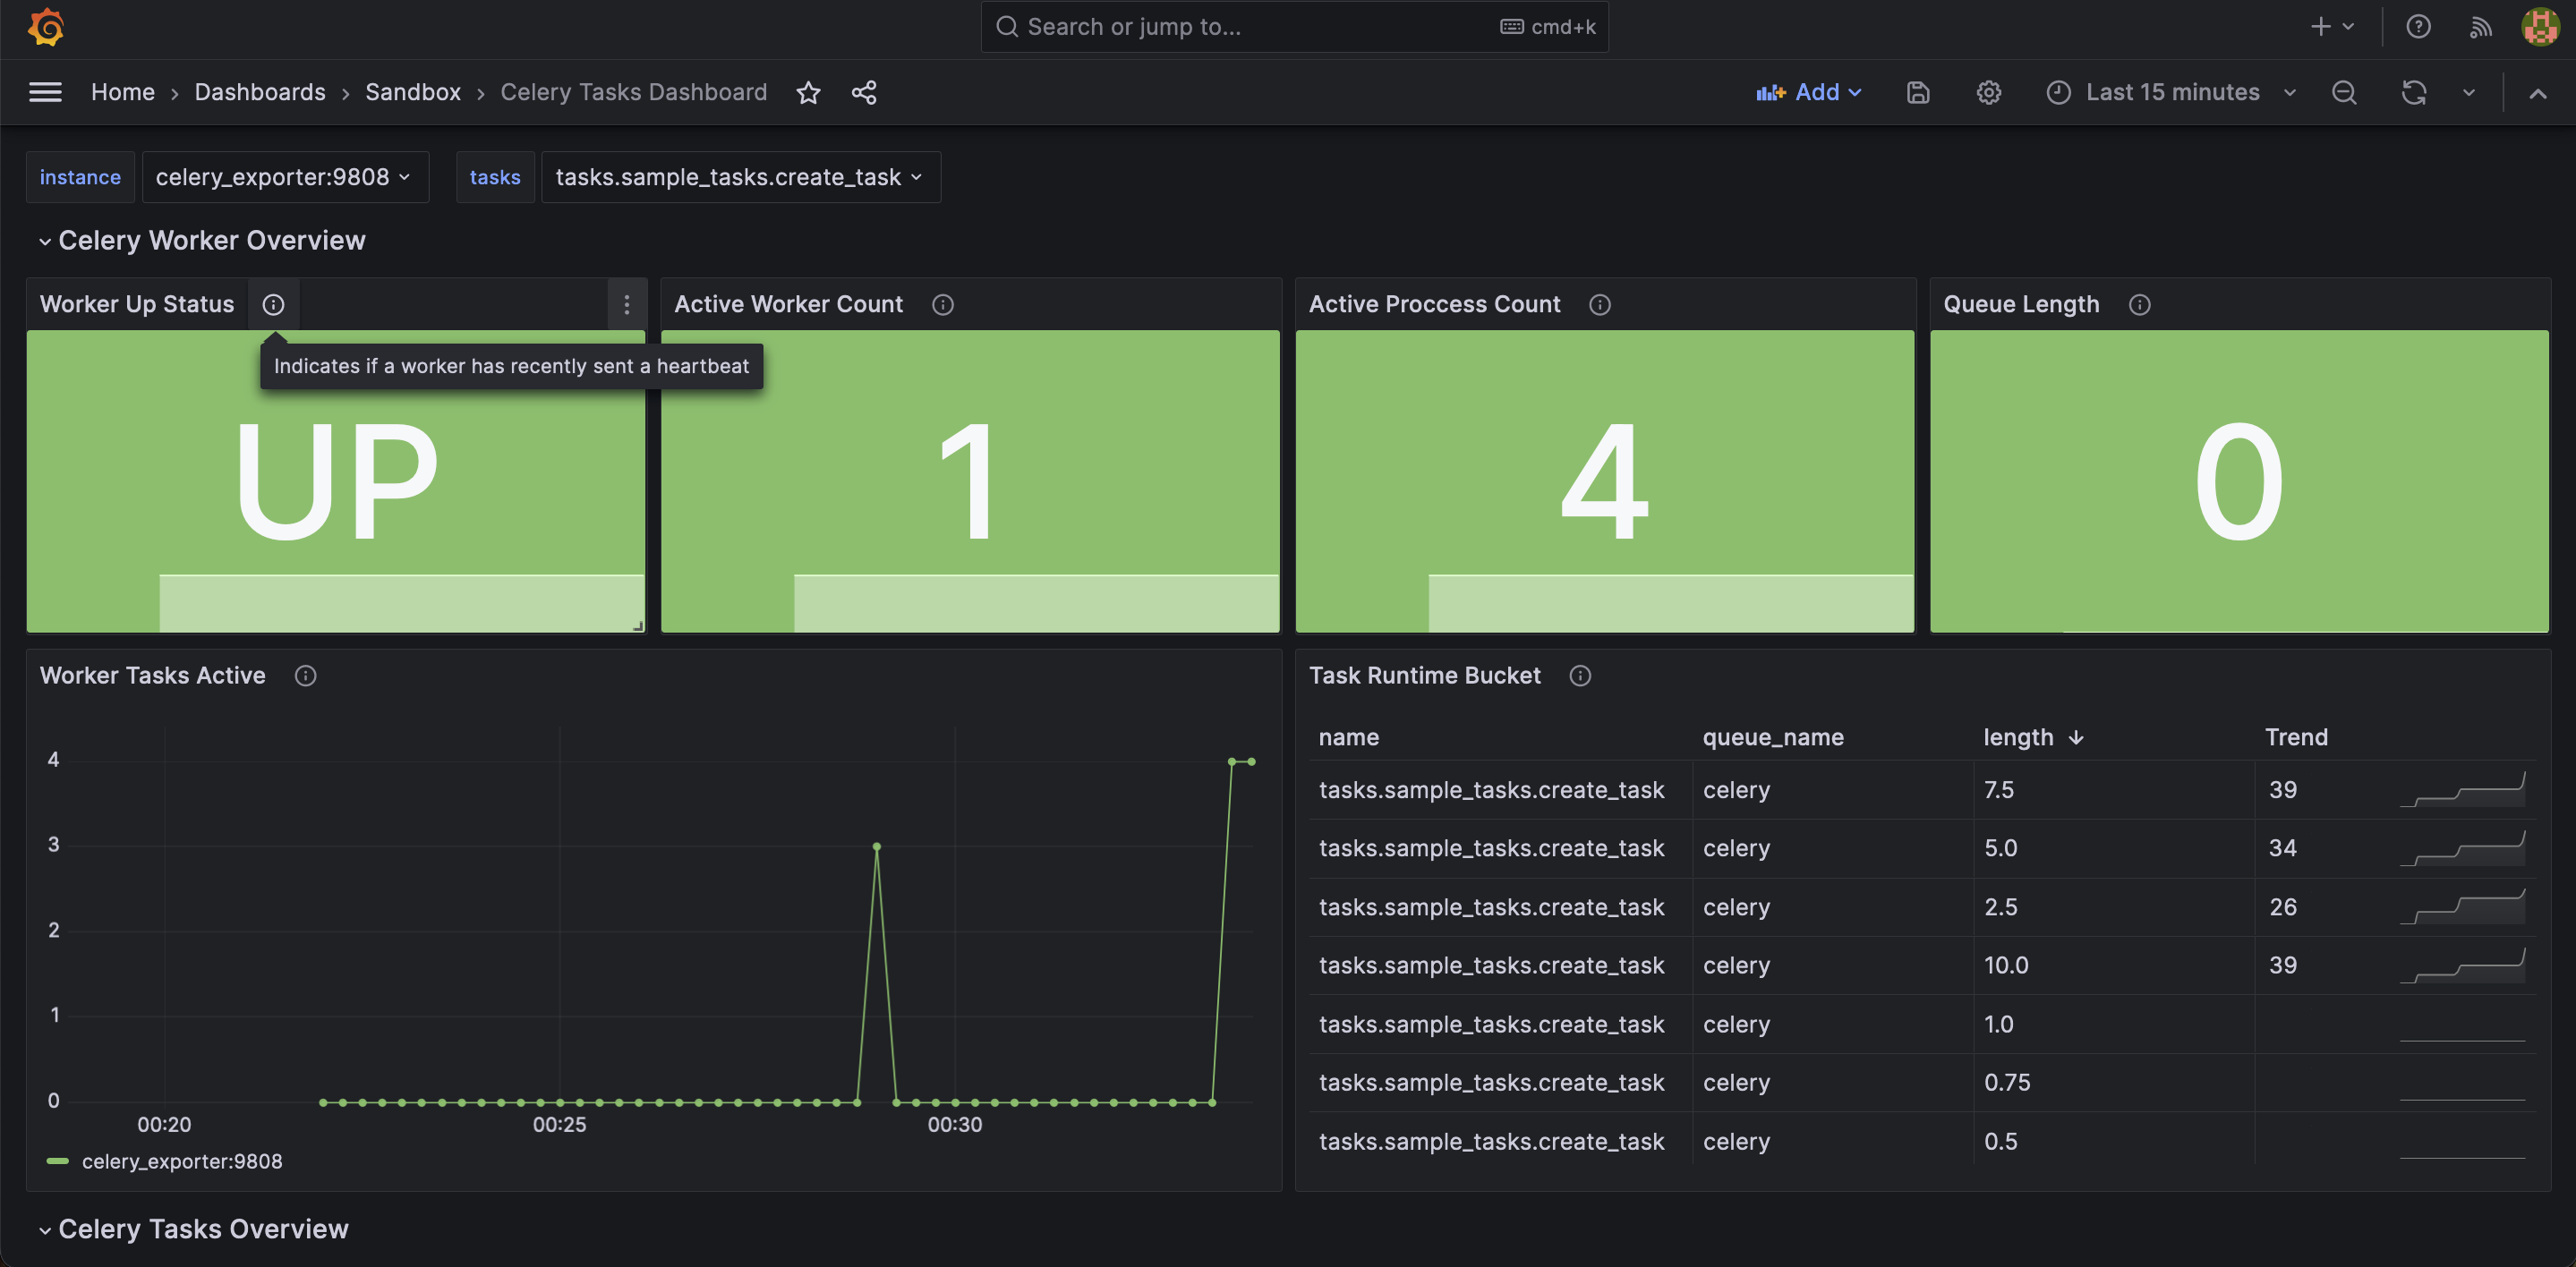
Simple dashboard for monitoring Celery tasks and workers. Suitable for Python developers who use Celery along with Flask, Django or FastAPI
Screenshots
Used Metrics 1414
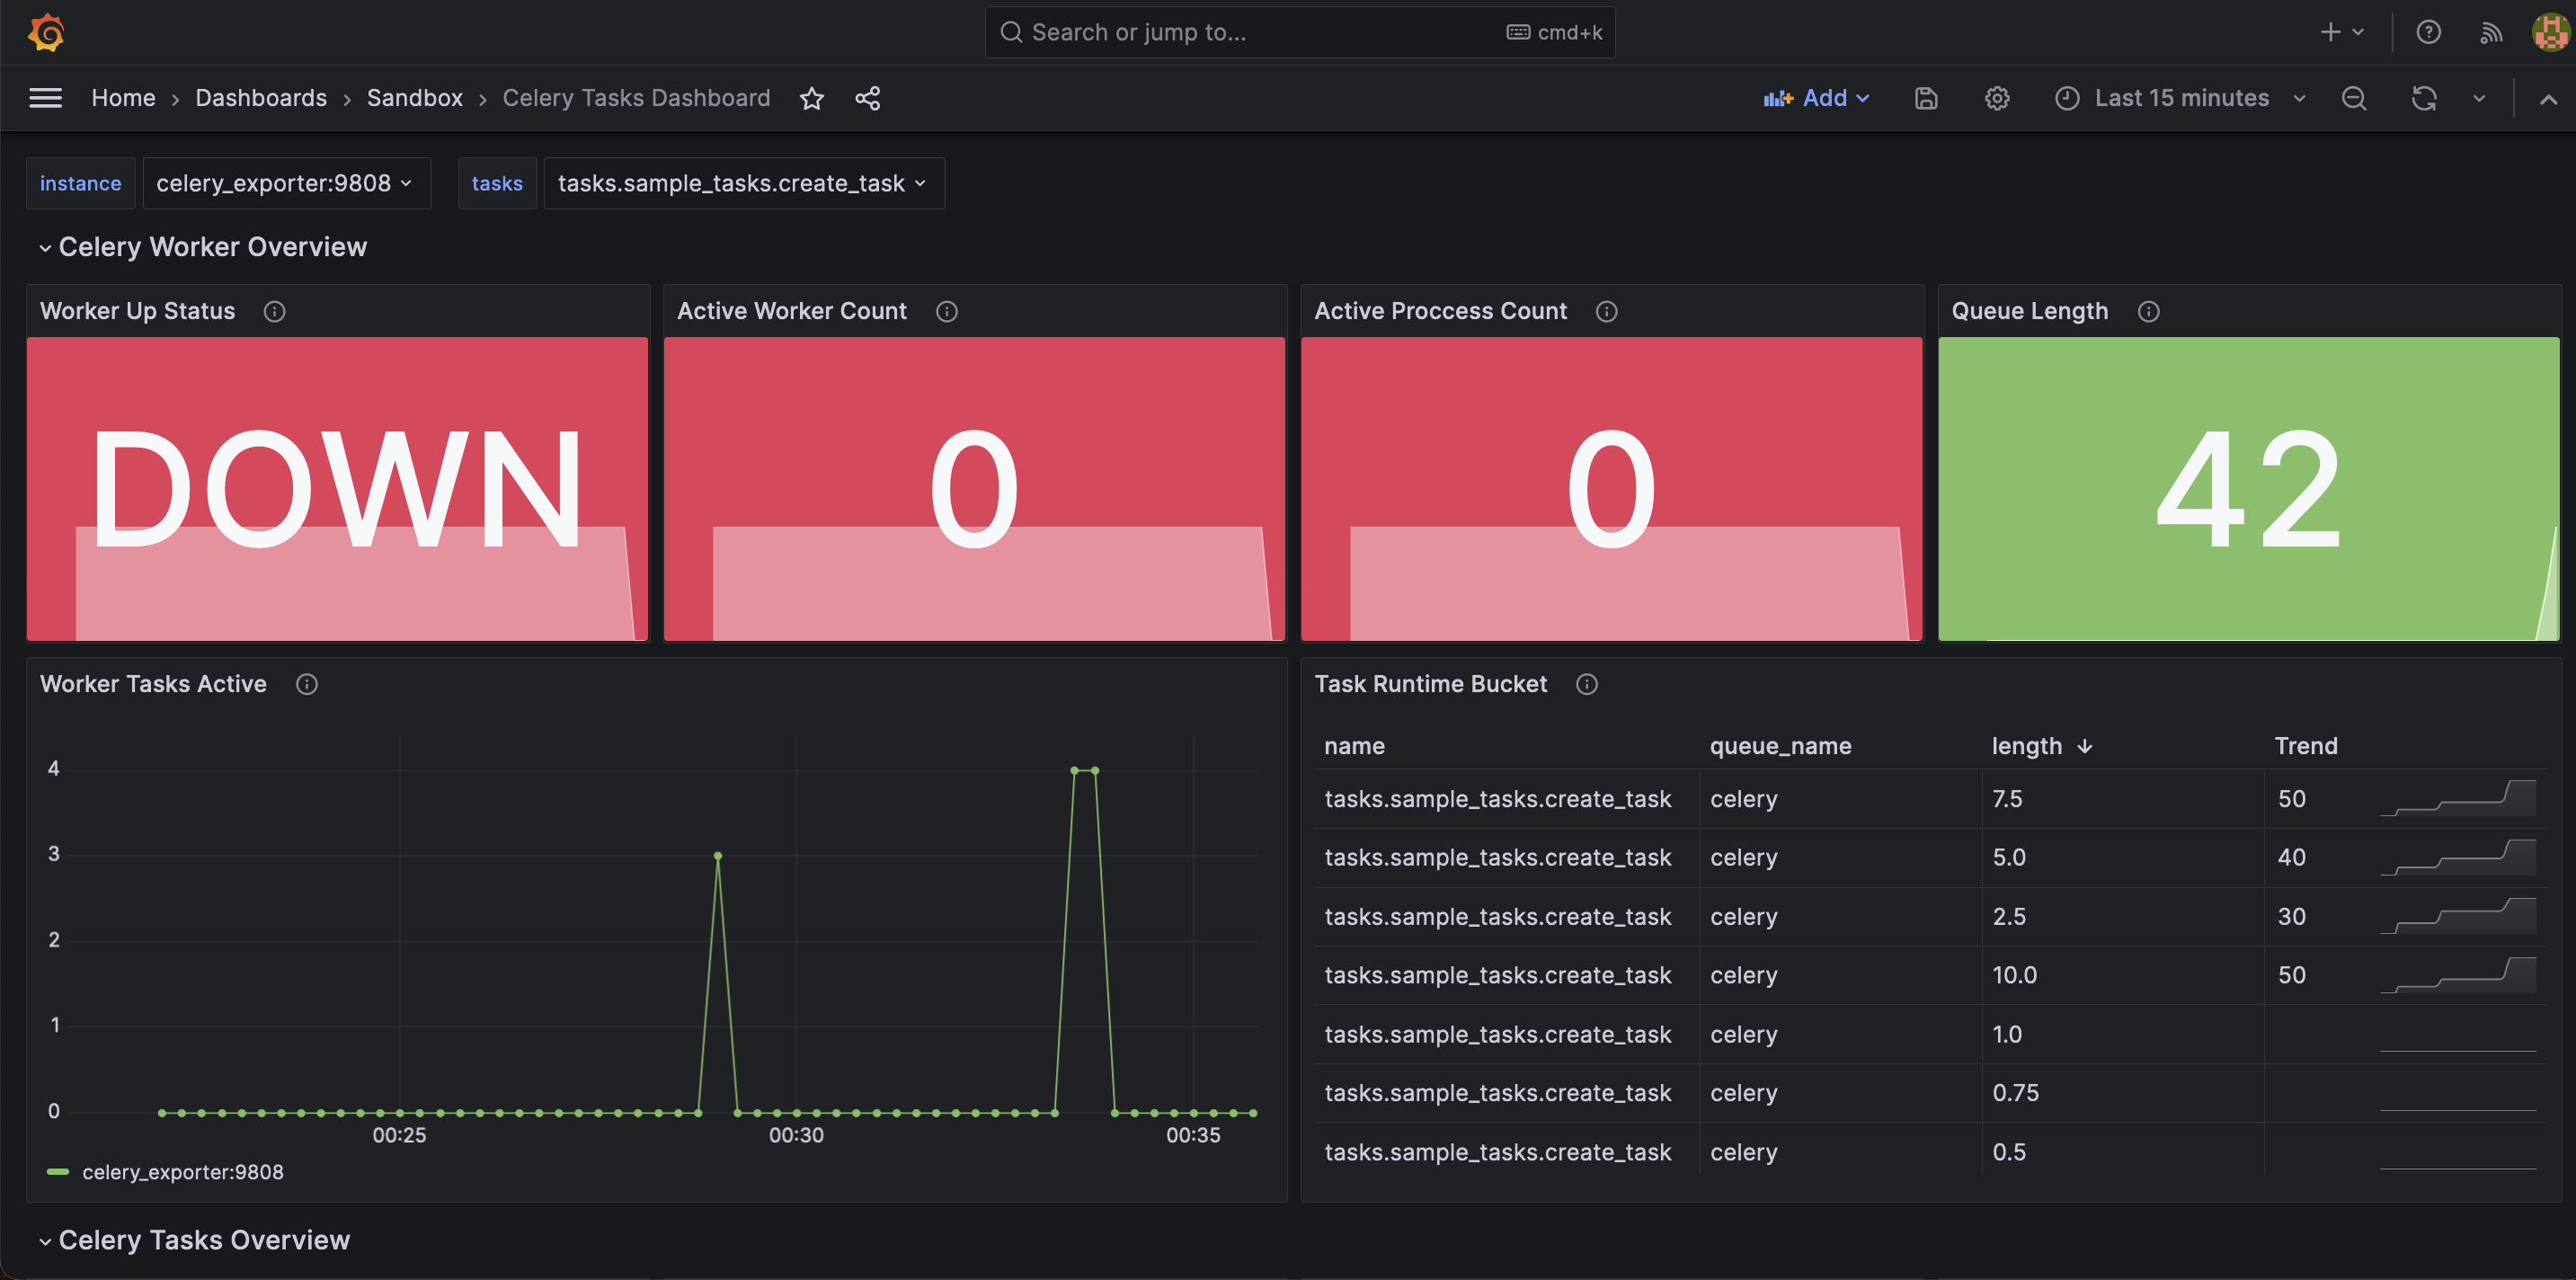
celery_active_process_count
celery_active_worker_count
celery_queue_length
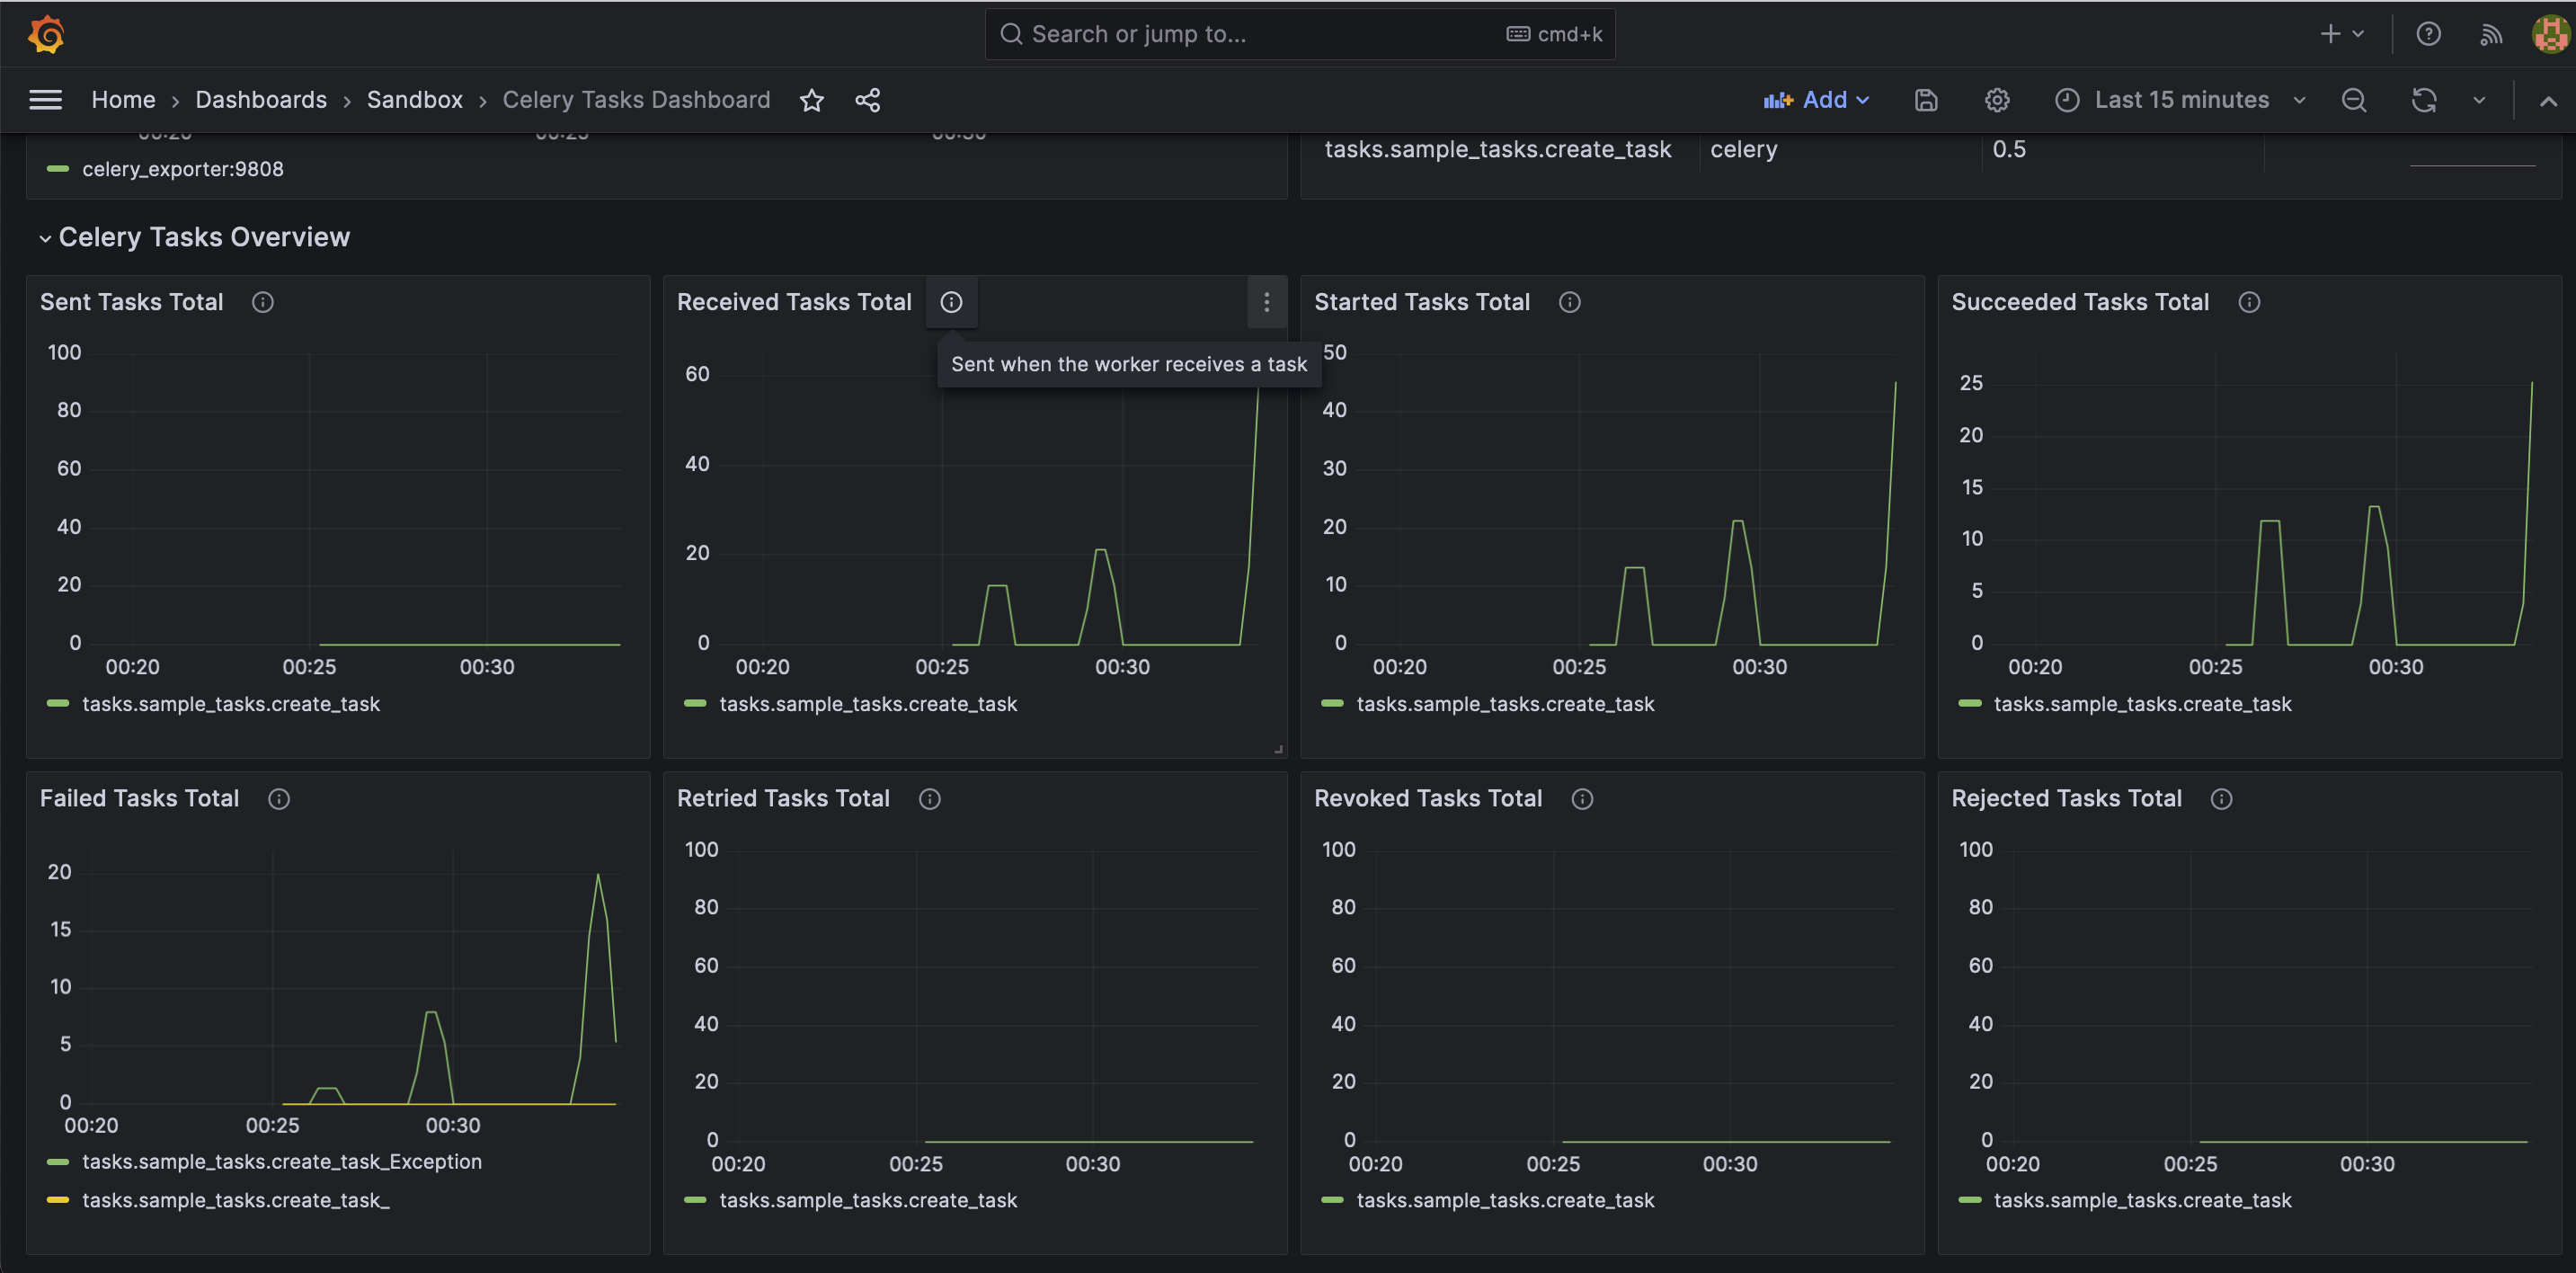
celery_task_failed_total
celery_task_received_total
celery_task_rejected_total
celery_task_retried_total
celery_task_revoked_total
celery_task_runtime_bucket
celery_task_sent_total
celery_task_started_total
celery_task_succeeded_total
celery_worker_tasks_active
celery_worker_up
Get Dashboard✕
Download
Copy to Clipboard