Celery Monitoring 5,6055,605 3.0 (1 reviews)
4/11/2019
4/11/2019
1
Host Metrics
Prometheus
Description
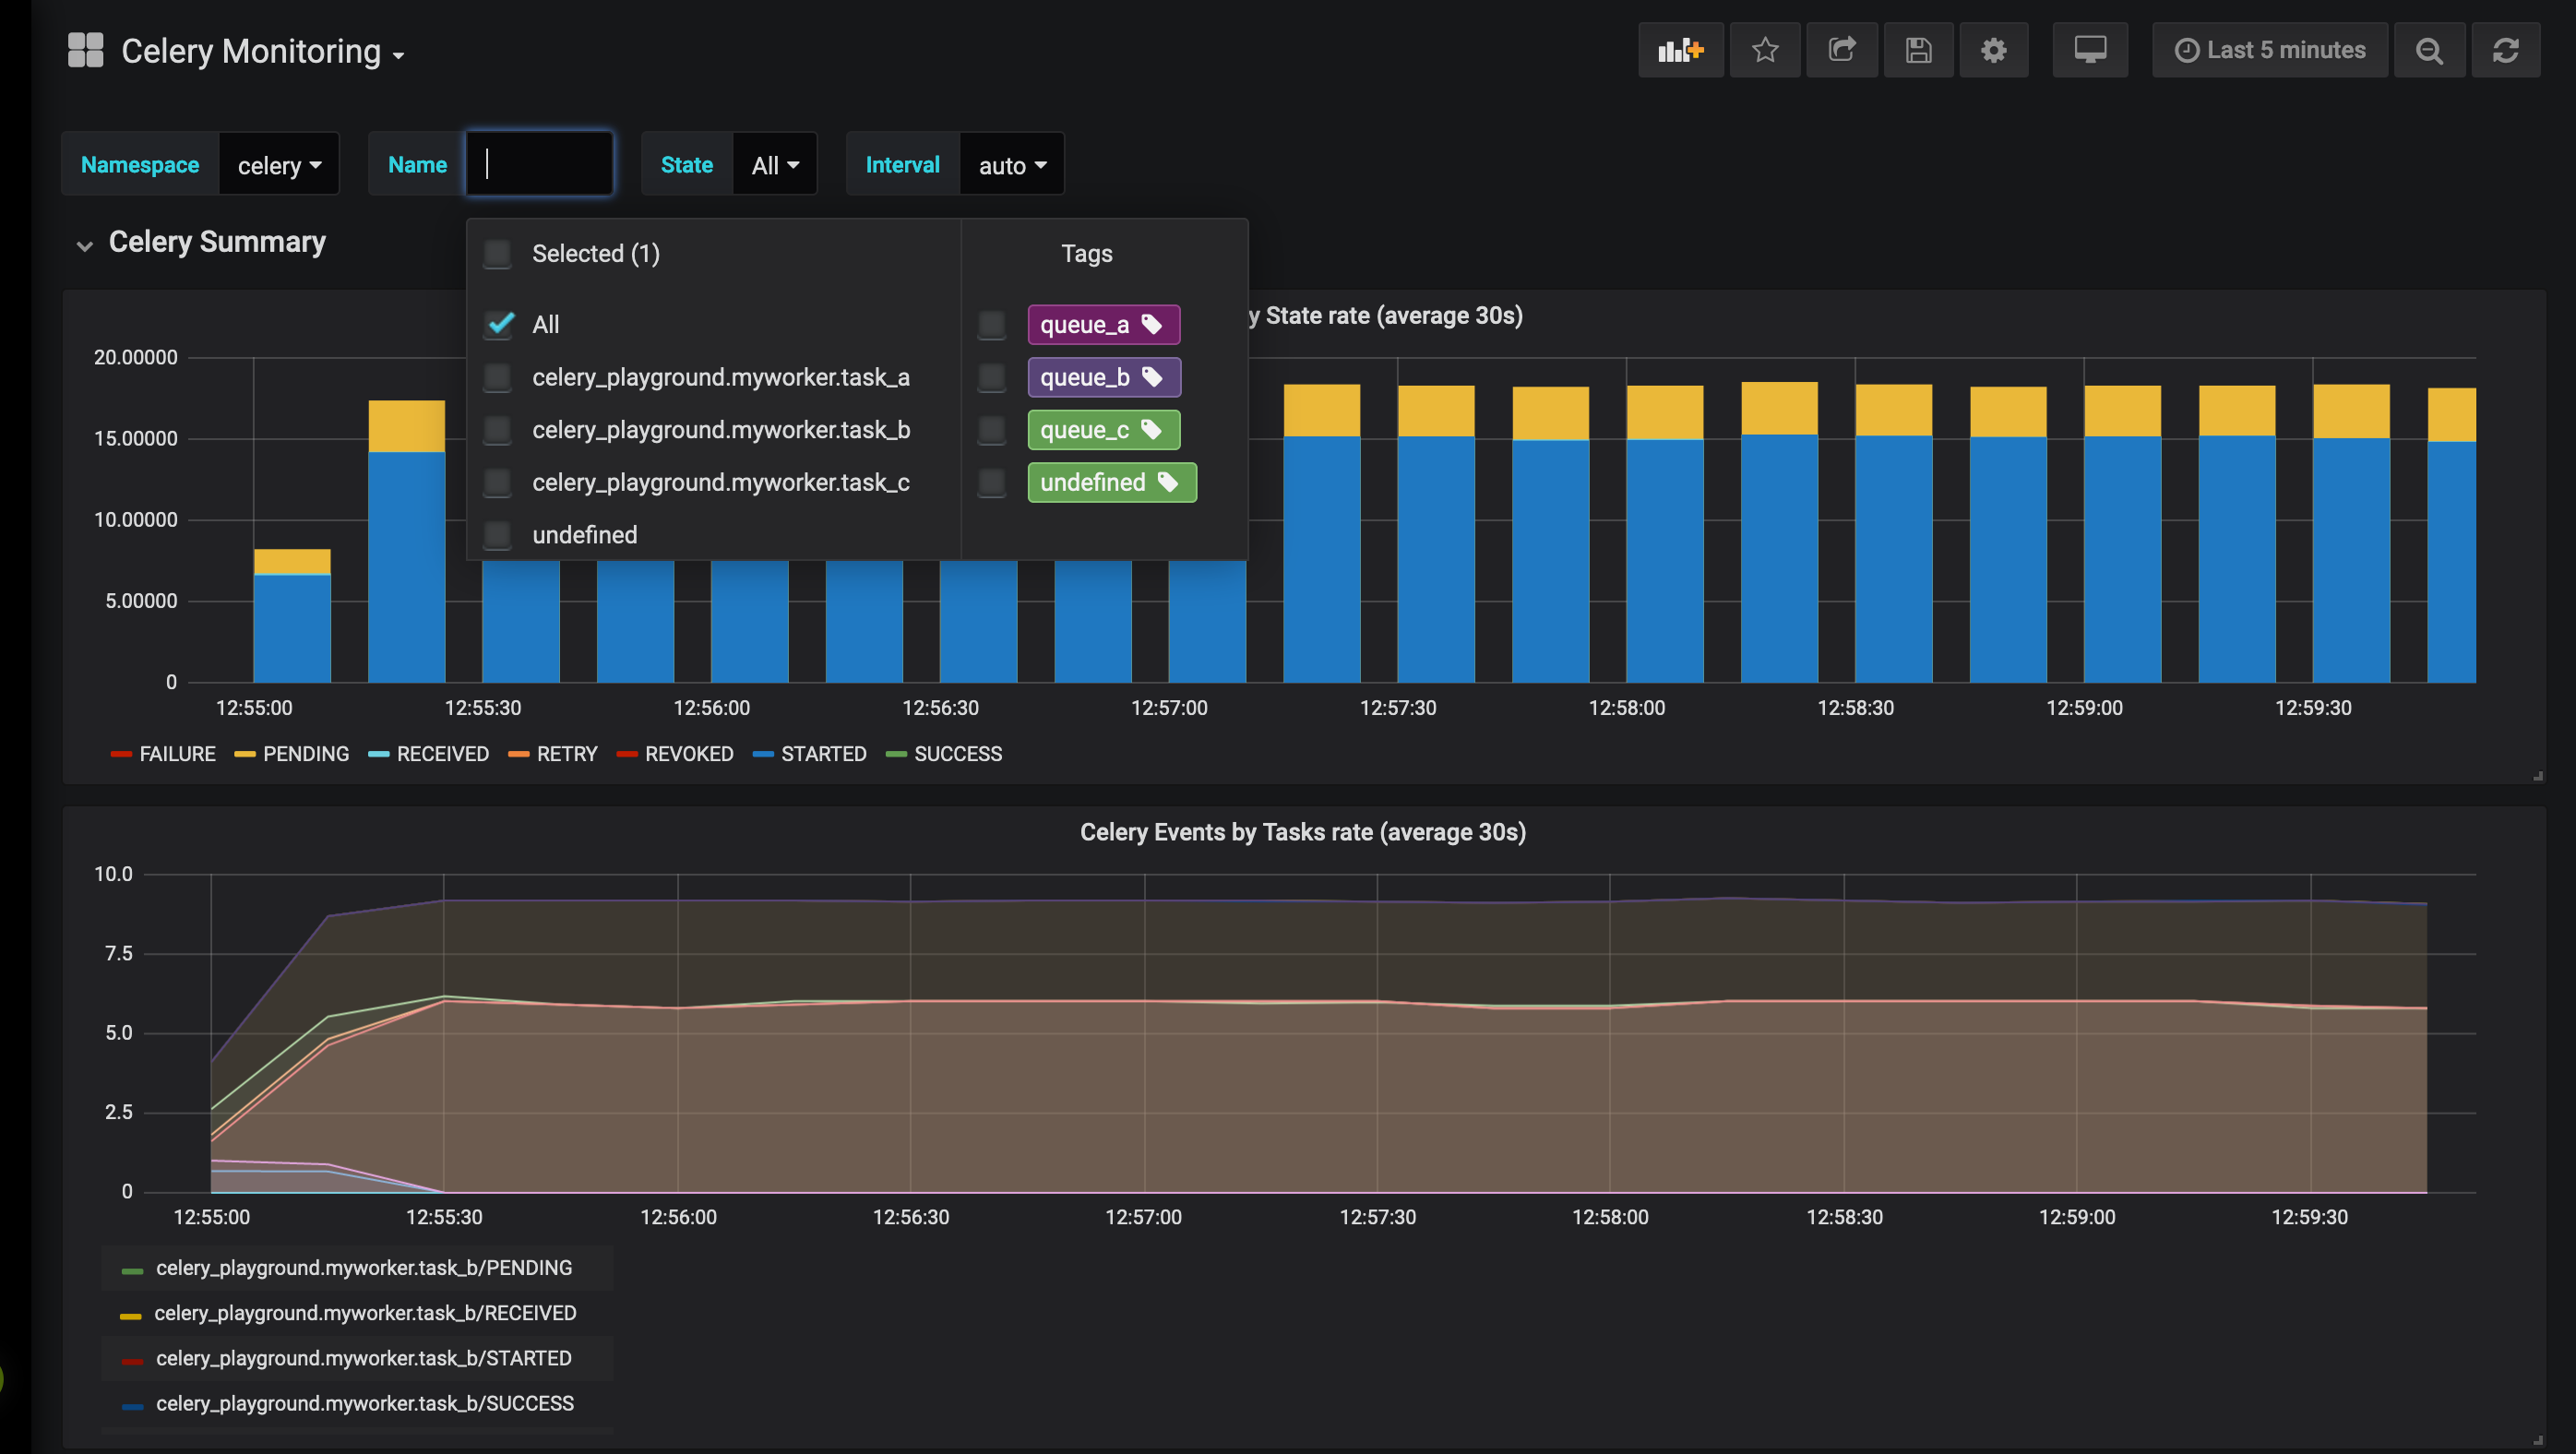
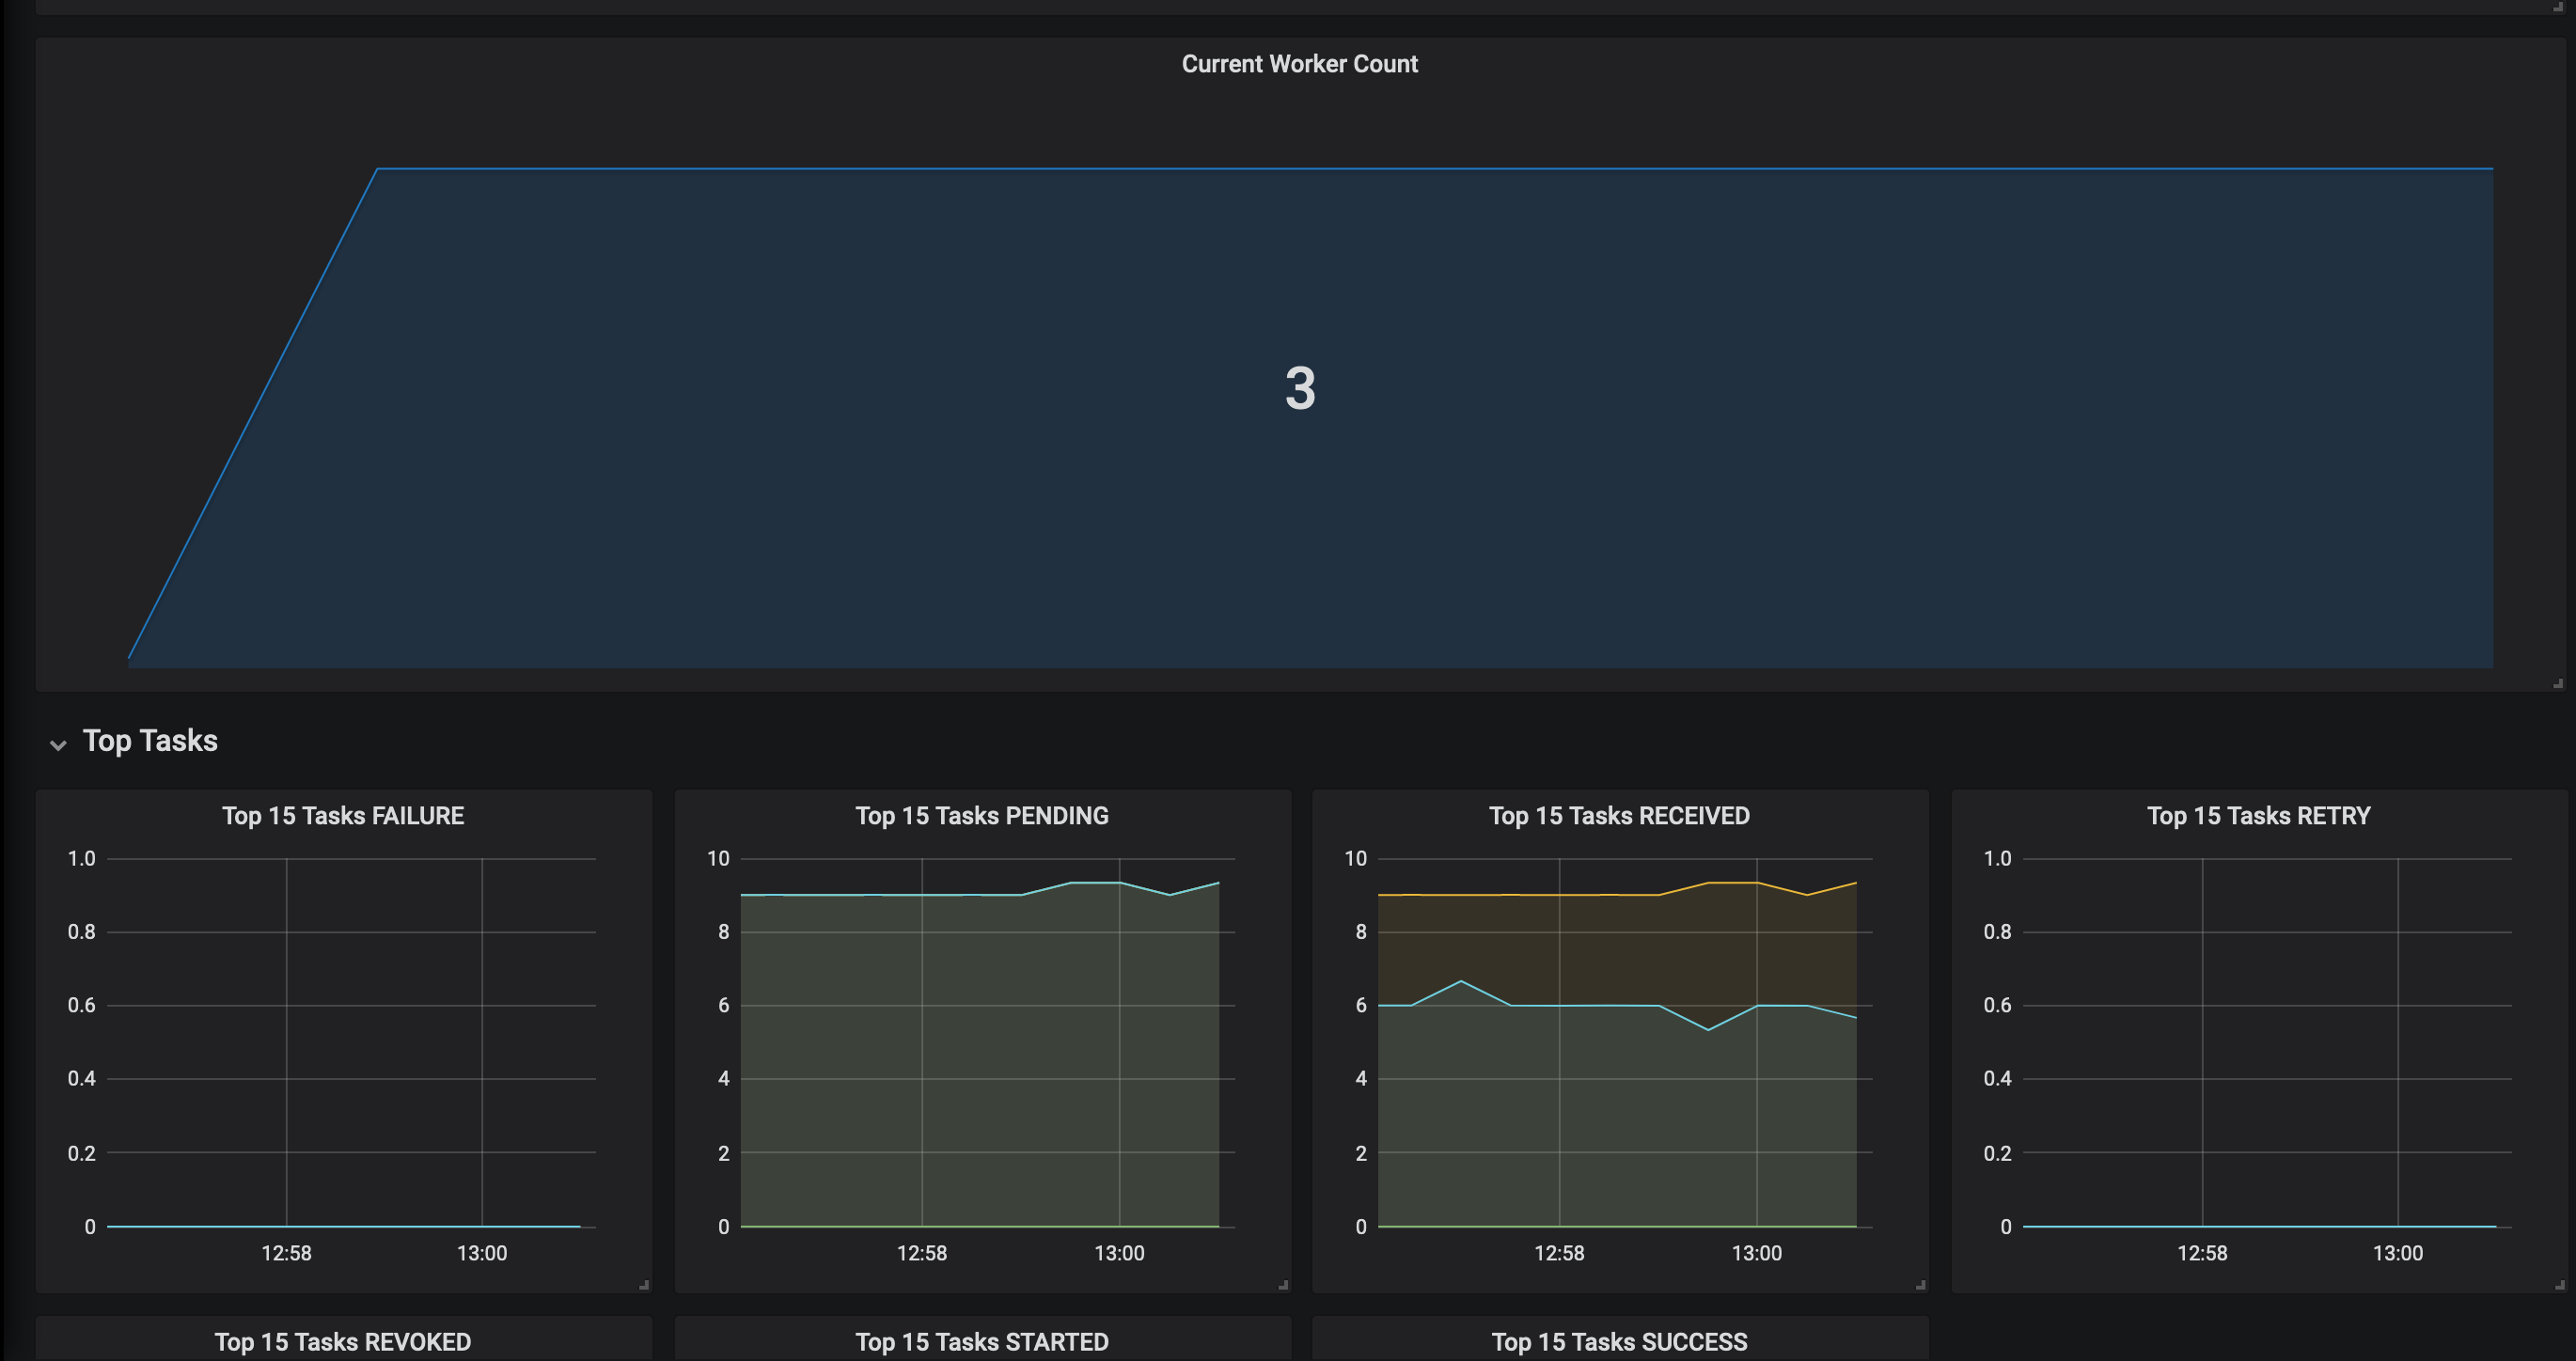
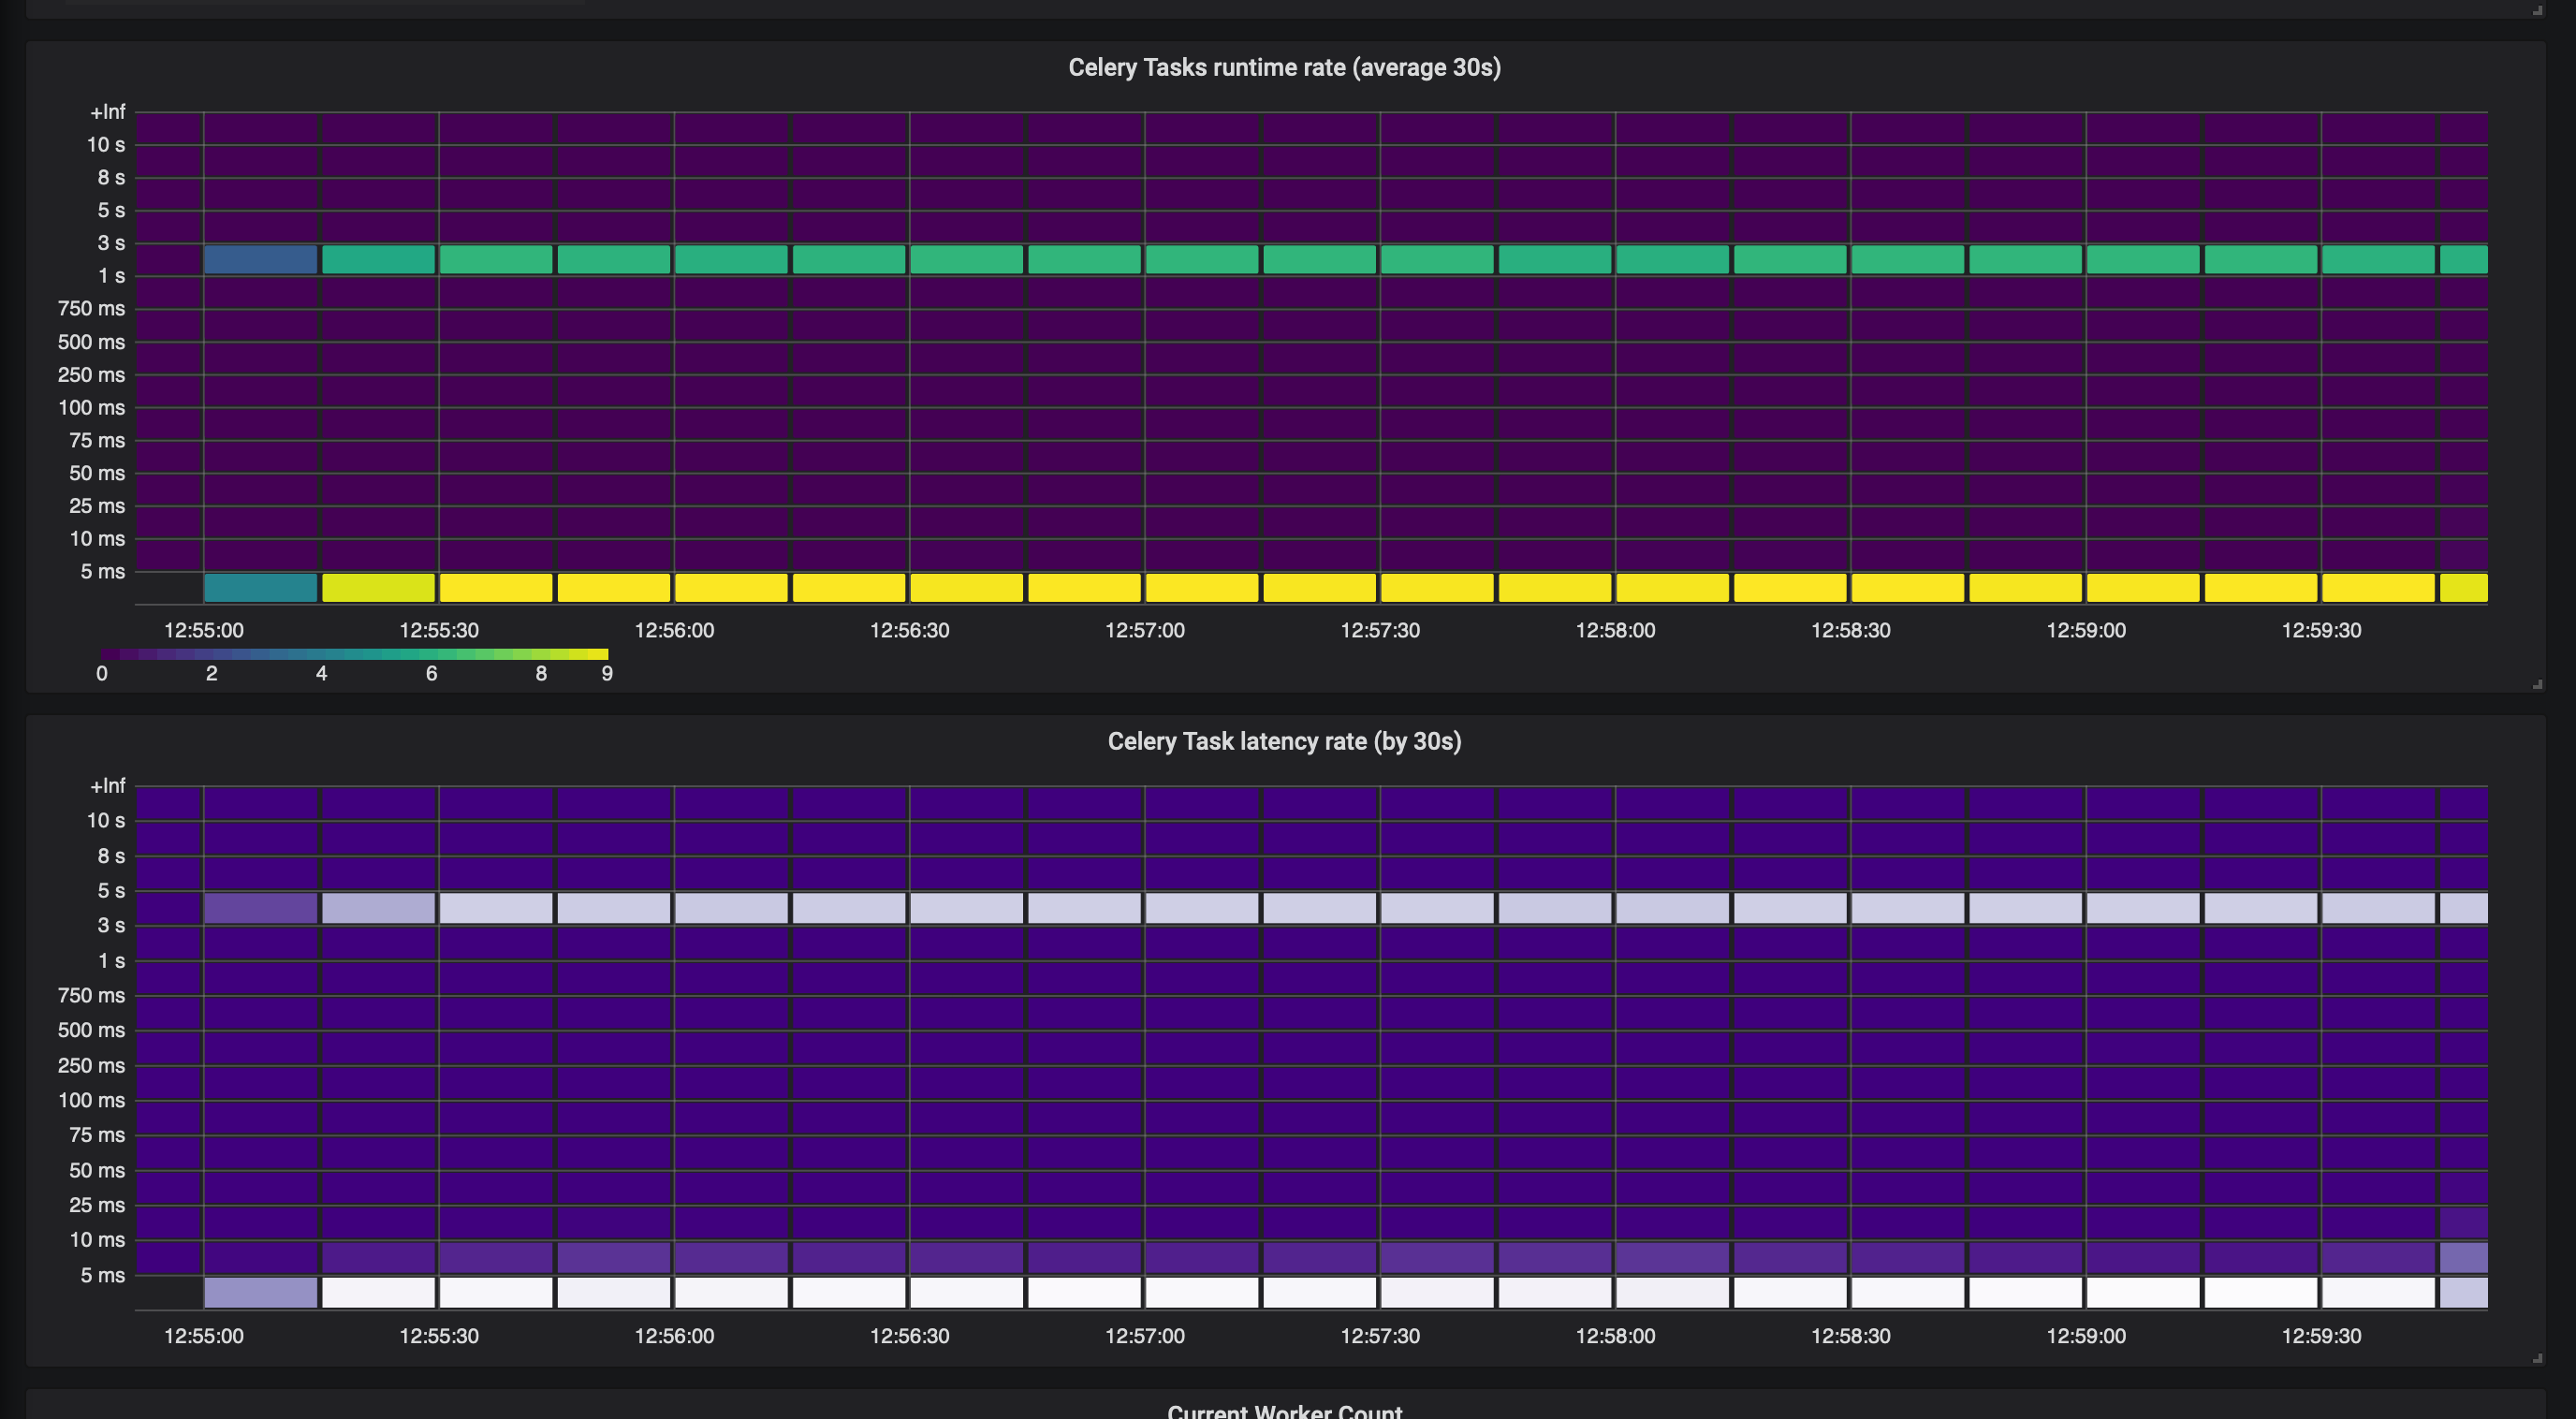
Monitor Celery Tasks with Prometheus and celery-exporter
Screenshots
Used Metrics 55
Interval
celery_tasks_latency_seconds_bucket
celery_tasks_runtime_seconds_bucket
celery_tasks_total
celery_workers
Get Dashboard✕
Download
Copy to Clipboard