cassandra-dashboard 9,8409,840
9/13/2019
8/23/2022
3
Databases
>=9.1.0
Prometheus
Description
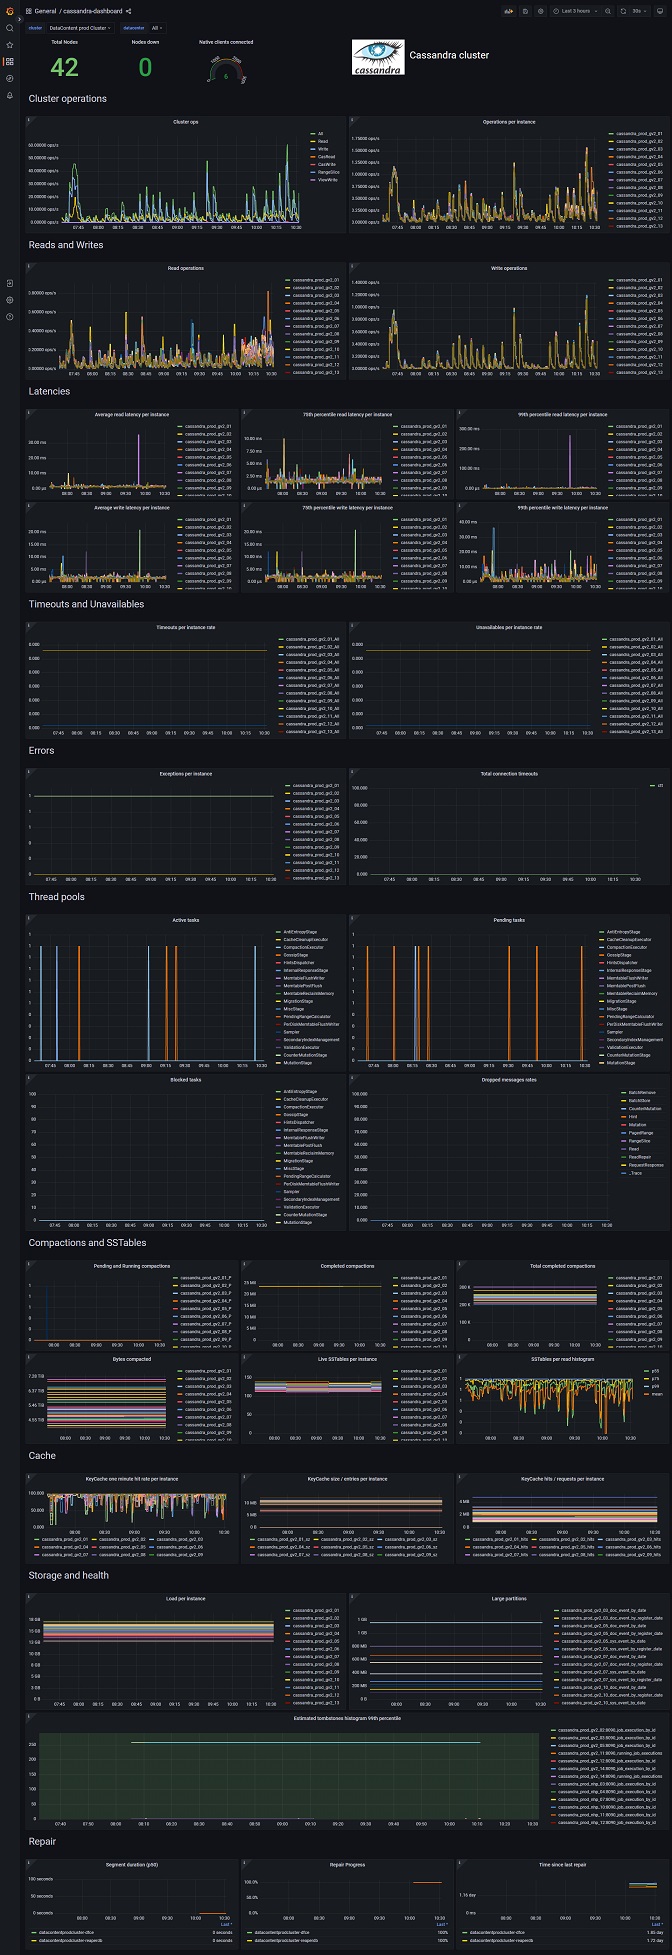
Monitoring for Cassandra clusters
Screenshots
Used Metrics 77
:
cassandra_stats
instance
io_cassandrareaper_service_RepairRunner_millisSinceLastRepair
io_cassandrareaper_service_RepairRunner_repairProgress
io_cassandrareaper_service_SegmentRunner_repairing
short_instance
Get Dashboard✕
Download
Copy to Clipboard