Cassandra 929,067929,067
5/25/2018
6/14/2018
3
Databases
>=5.1.1
Prometheus
Description
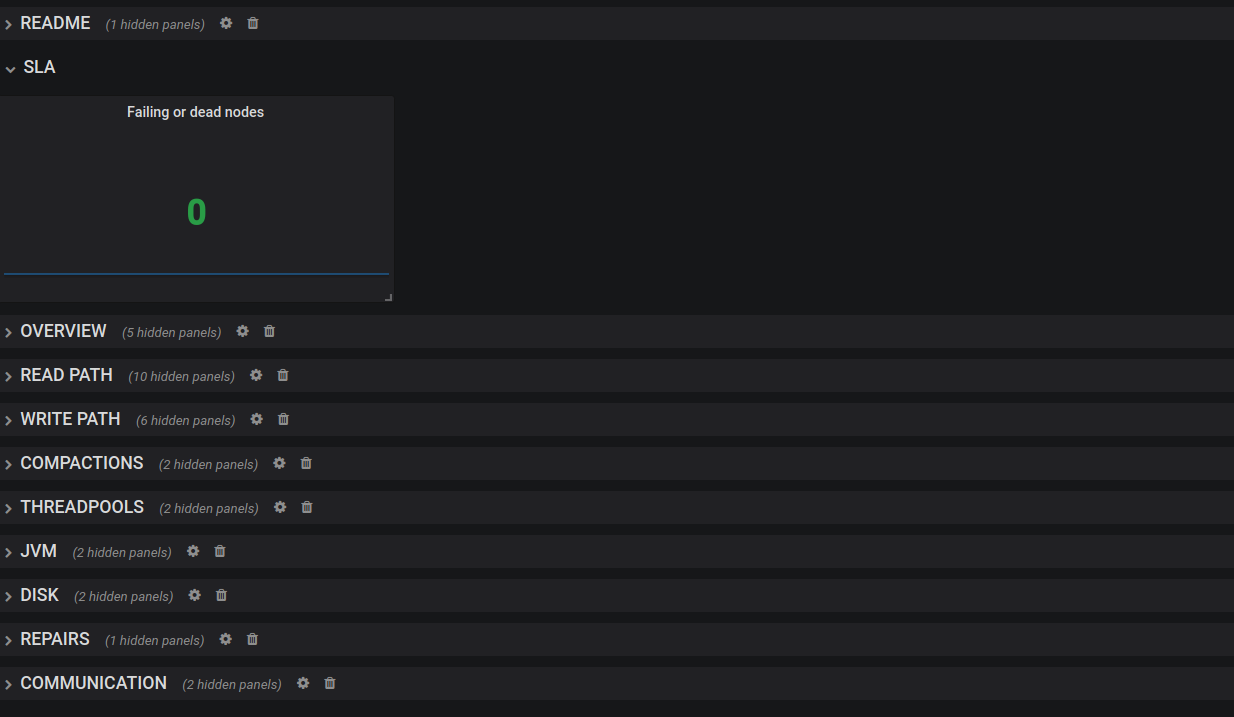
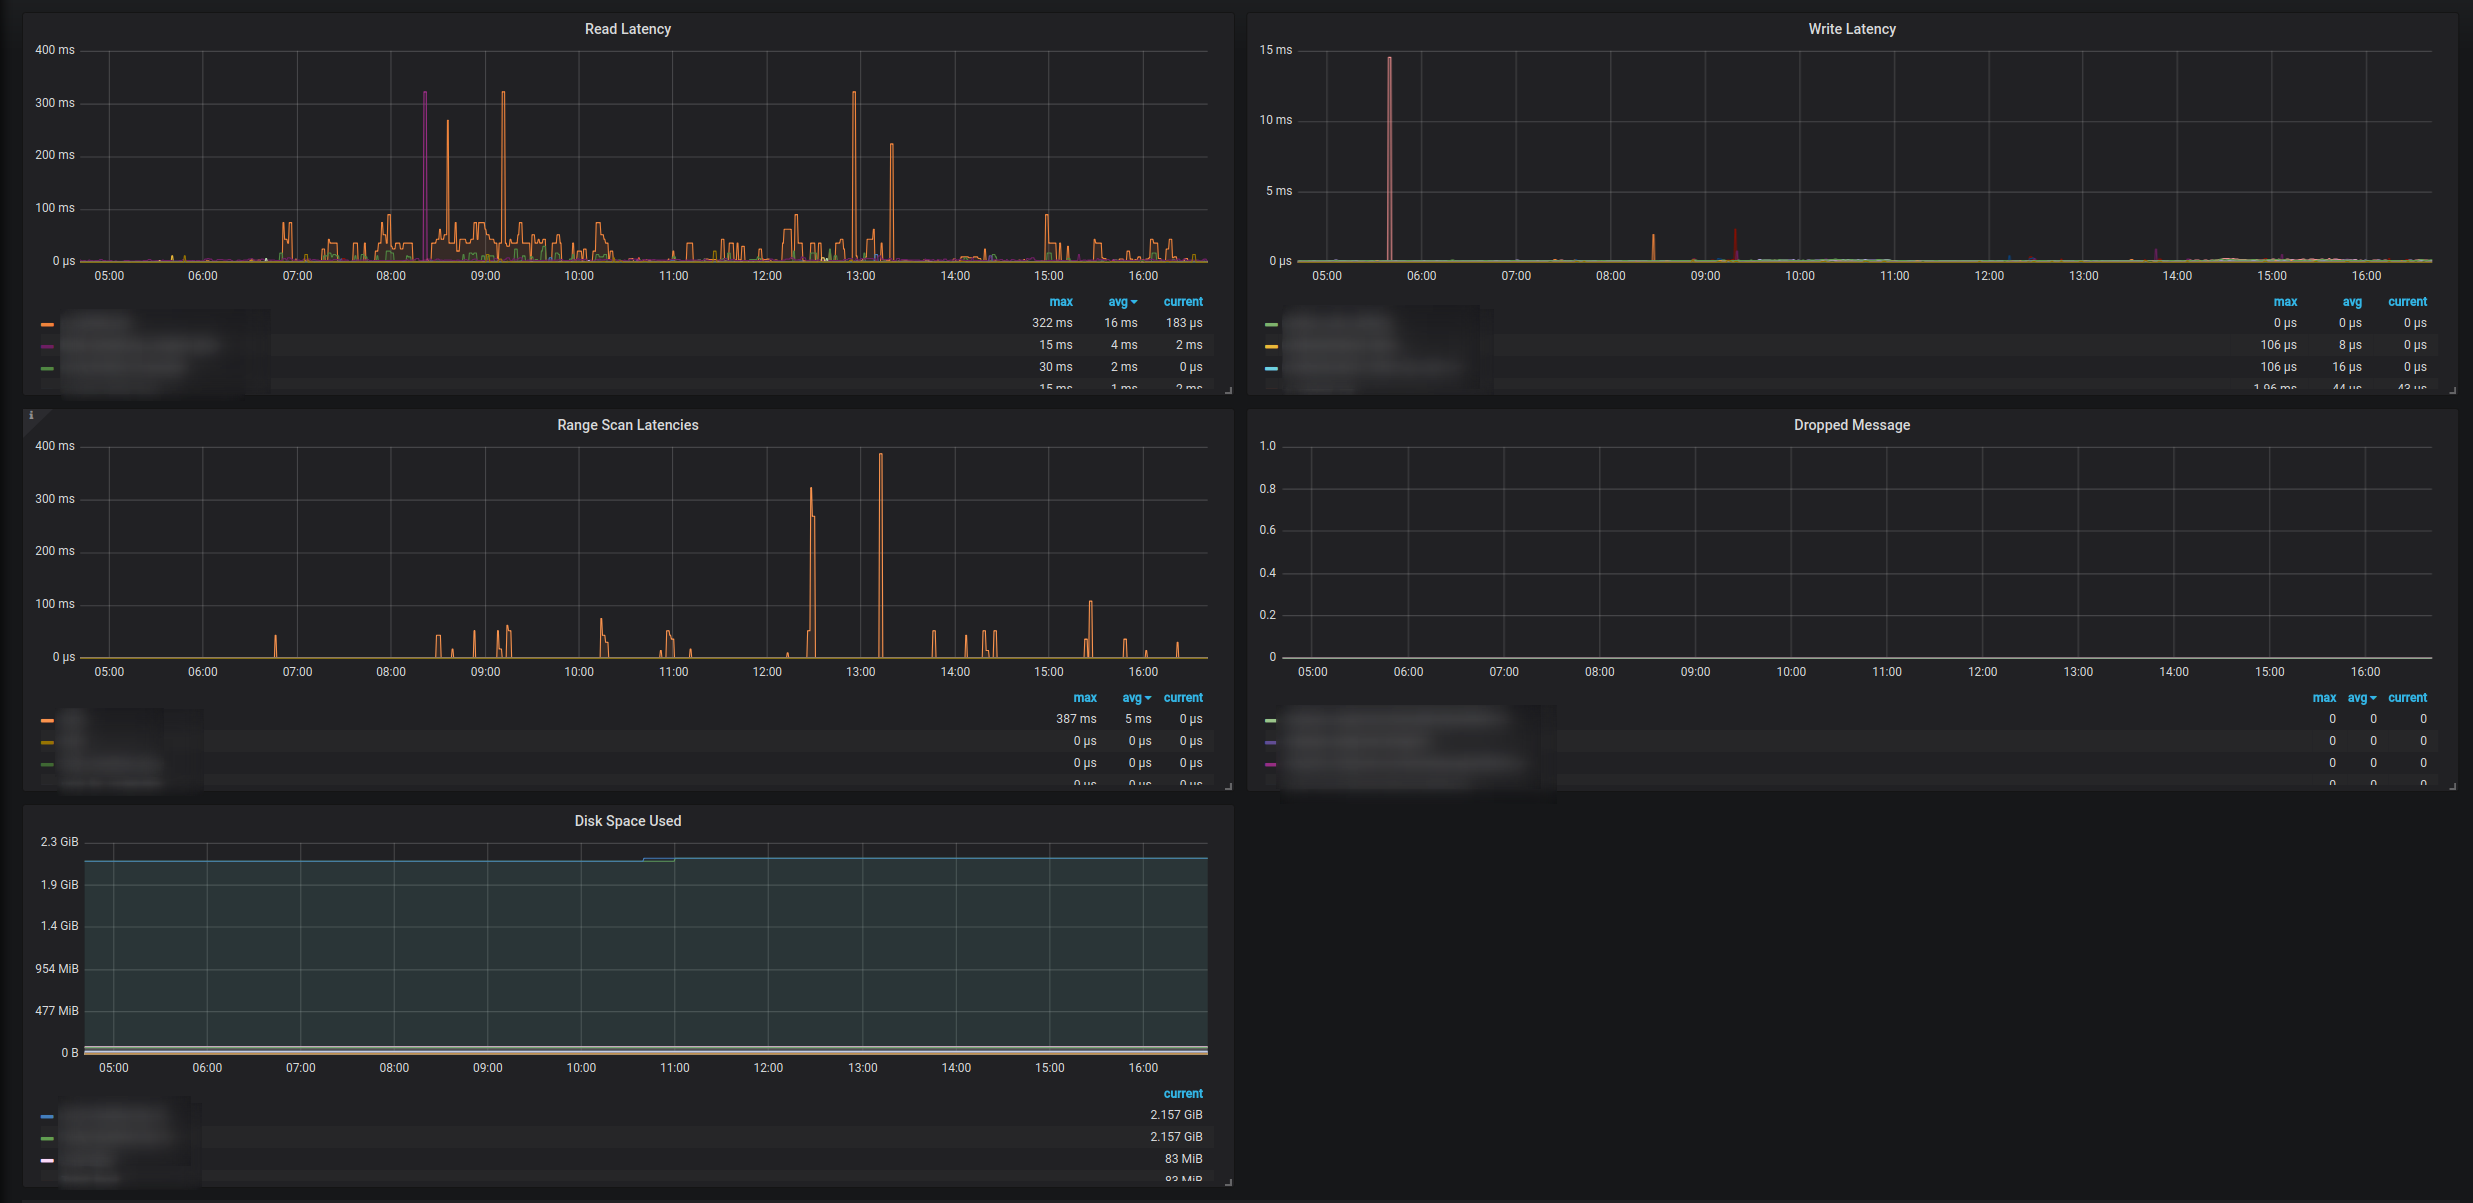
This dashboard monitors Cassandra cluster health and readiness, focusing on node availability and pod lifecycle. It visualizes pod and StatefulSet status through metrics like kube_statefulset_replicas and kube_statefulset_status_replicas, highlighting variance between desired and current replicas. A key panel such as "Failing or dead nodes" alerts on unrecoverable nodes or degraded state, providing frontline visibility into cluster resilience.
Screenshots
Used Metrics 22
kube_statefulset_replicas
kube_statefulset_status_replicas
Get Dashboard✕
Download
Copy to Clipboard