Calico Felix 106,465106,465 5.0 (2 reviews)
Description
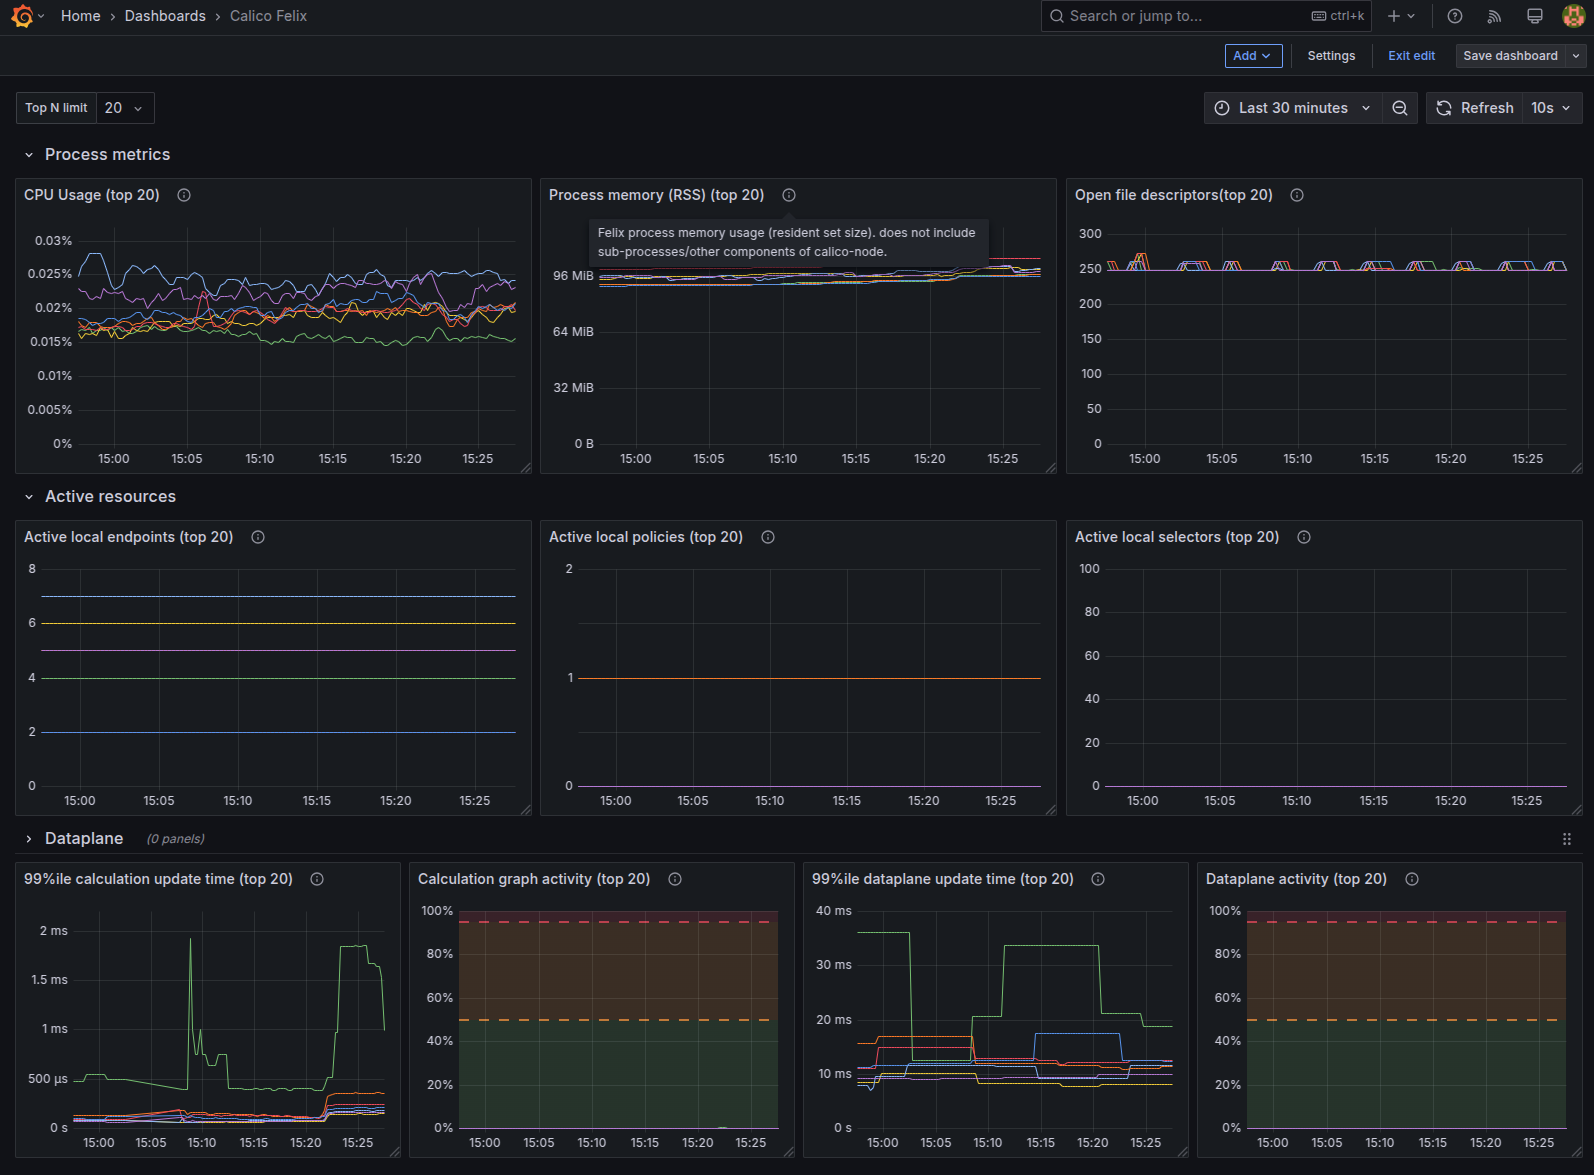
This dashboard monitors Calico Felix runtime health and scalability, focusing on cluster composition, policy/endpoint activity, and resource usage. It highlights key metrics such as felix_cluster_num_hosts, felix_cluster_num_policies, and felix_cluster_num_workload_endpoints to track topology and policy coverage, while top N panels surface operational efficiency with metrics like Felix restarts/hr, Dataplane update load, and Runtime GC rate/min to flag instability or bottlenecks.
Screenshots
Used Metrics 3636
felix_active_local_endpoints
felix_active_local_policies
felix_active_local_selectors
felix_calc_graph_update_time_seconds
felix_calc_graph_update_time_seconds_count
felix_calc_graph_update_time_seconds_sum
felix_cluster_num_host_endpoints
felix_cluster_num_hosts
felix_cluster_num_policies
felix_cluster_num_profiles
felix_cluster_num_tiers
felix_cluster_num_workload_endpoints
felix_collector_conntrack_processing_latency_seconds_sum
felix_collector_epstats
felix_int_dataplane_apply_time_seconds
felix_int_dataplane_apply_time_seconds_count
felix_int_dataplane_apply_time_seconds_sum
felix_ipset_errors
felix_ipsets_calico
felix_iptables_restore_errors
felix_iptables_rules
felix_iptables_save_errors
felix_nflog_aggregates_created
felix_nflog_aggregates_flushed
felix_nflog_block_time_seconds
felix_nflog_buffer_overruns
felix_nflog_logs_received
felix_resyncs_started
go_gc_duration_seconds_count
-
go_memstats_next_gc_bytes
-
process_cpu_seconds_total
-
process_open_fds
-
process_resident_memory_bytes
-
process_start_time_seconds
top_n
topk