cadvisor dashboard
7,310

Created 10/18/2023
Updated 11/24/2024
Revision 6
Categories
DockerHost MetricsWeb Servers
Grafana Version >=11.1.0
Datasources
Prometheus

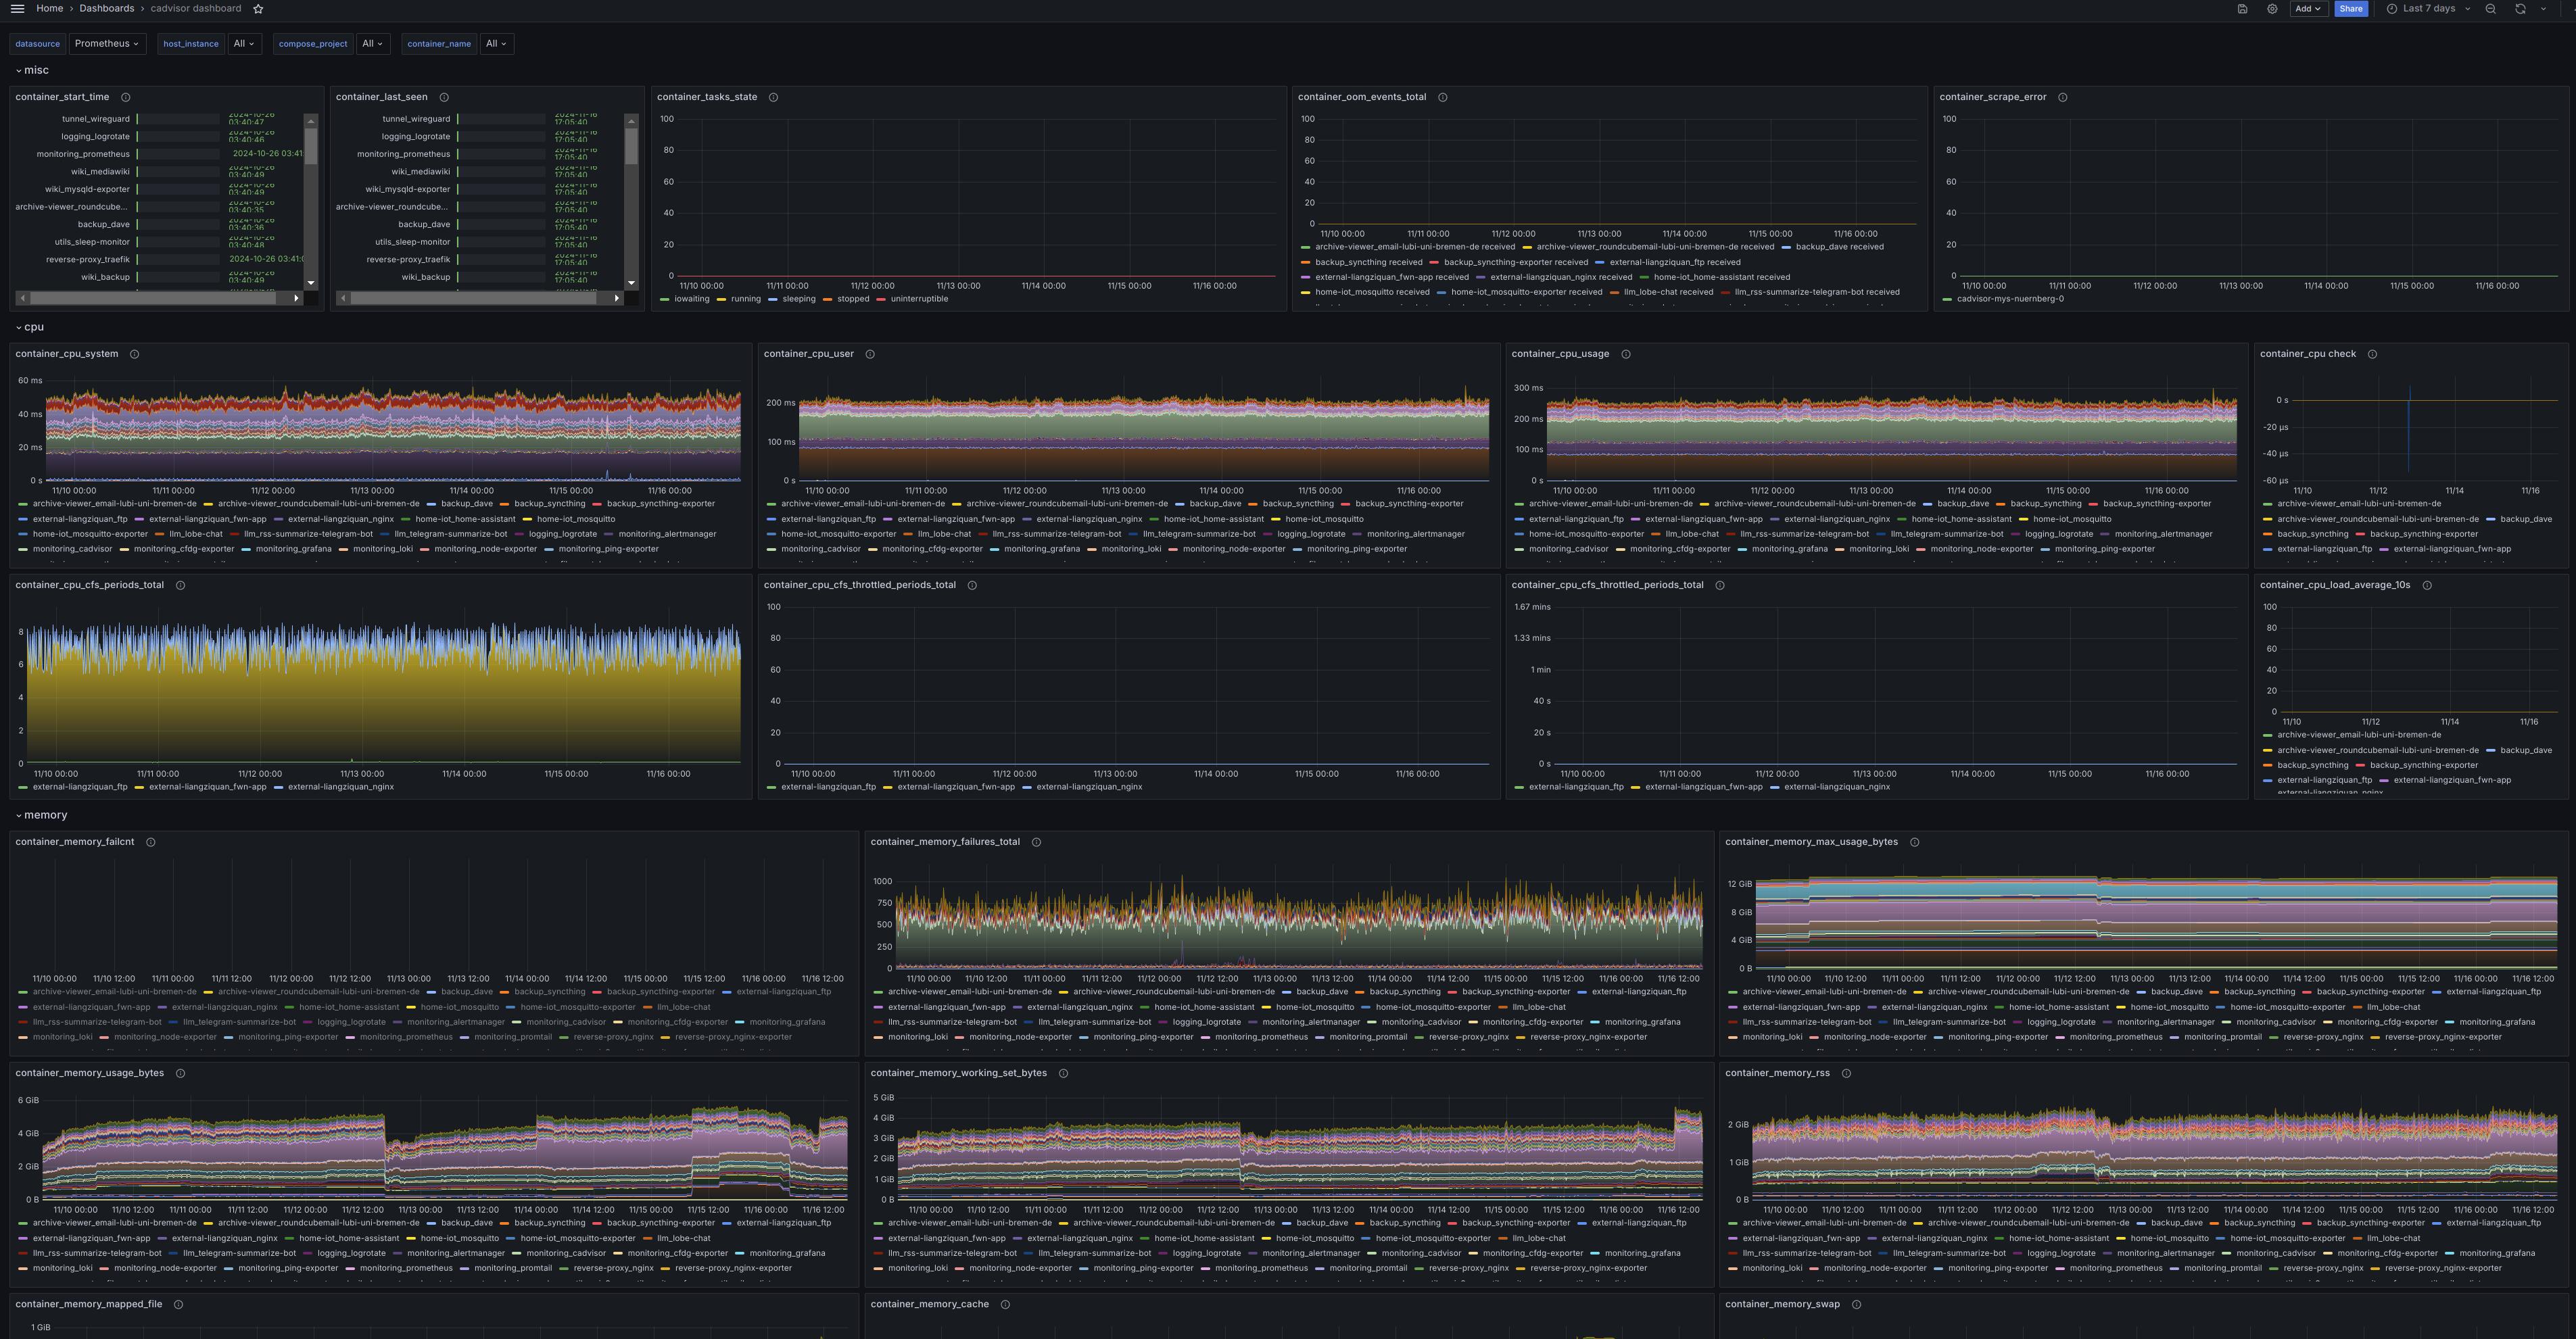
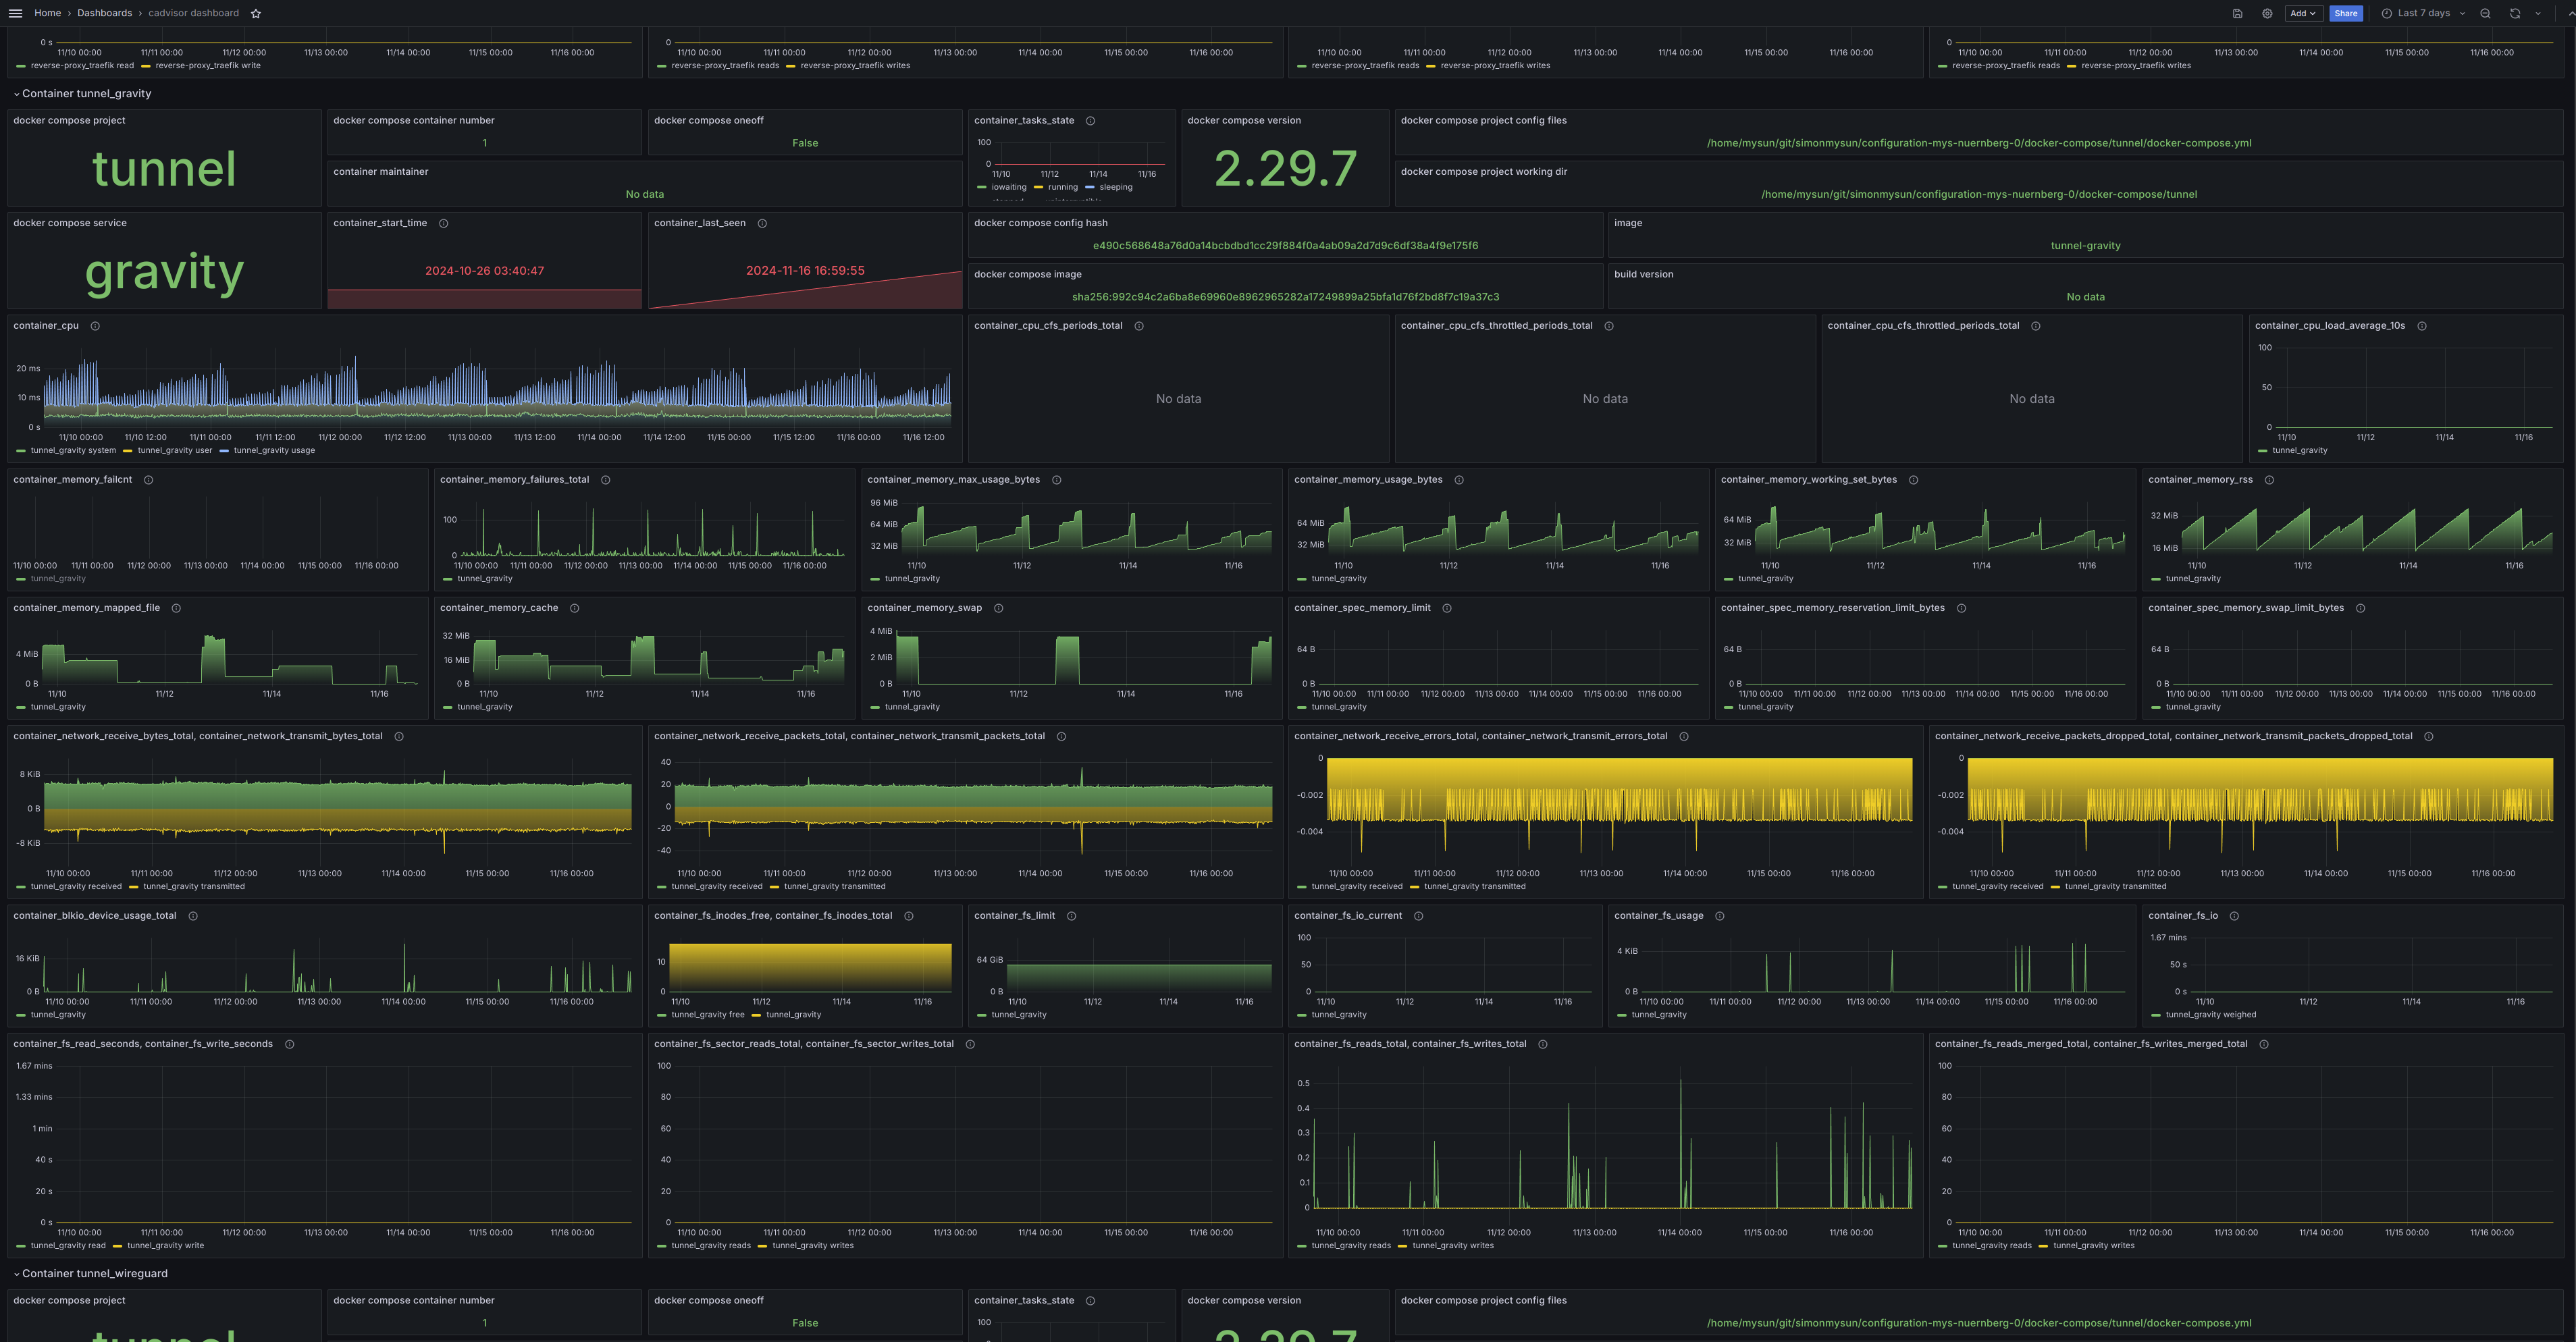
I created this cadvisor dashboard to show everything scraped from cadvisor.

  • Expanding all the rows may consume too much resources.
  • Limit the containers by selecting compose_project.
  • First few rows are stacked. Container rows are not

If you have any issues or suggestions, please email mail@maoyin.eu.

Changelog

  • rev. 1
    • Initial upload
  • rev. 2
    • Adding datasource as a variable
    • Bumping to schema 39
    • tested with grafana:11.1.0 and cadvisor:v0.50.0
  • rev. 3
    • This is a duplicate upload of rev. 2
  • rev. 4
    • Adding default tags
  • rev. 5
    • Setting soft max on stacked panels of non-negative series. Many thanks to T. Krebs.
    • Adding description and links for checking updates and reporting issues
  • rev. 6
    • Including containers which are not managed by Docker Compose when "compose_project" is blank (all)
Get Dashboard
Download
Copy to Clipboard
Source Grafana.com