Caddy Monitoring 1,4651,465
3/28/2024
3/28/2024
1
Web Servers
>=10.4.1
PrometheusLoki
Description
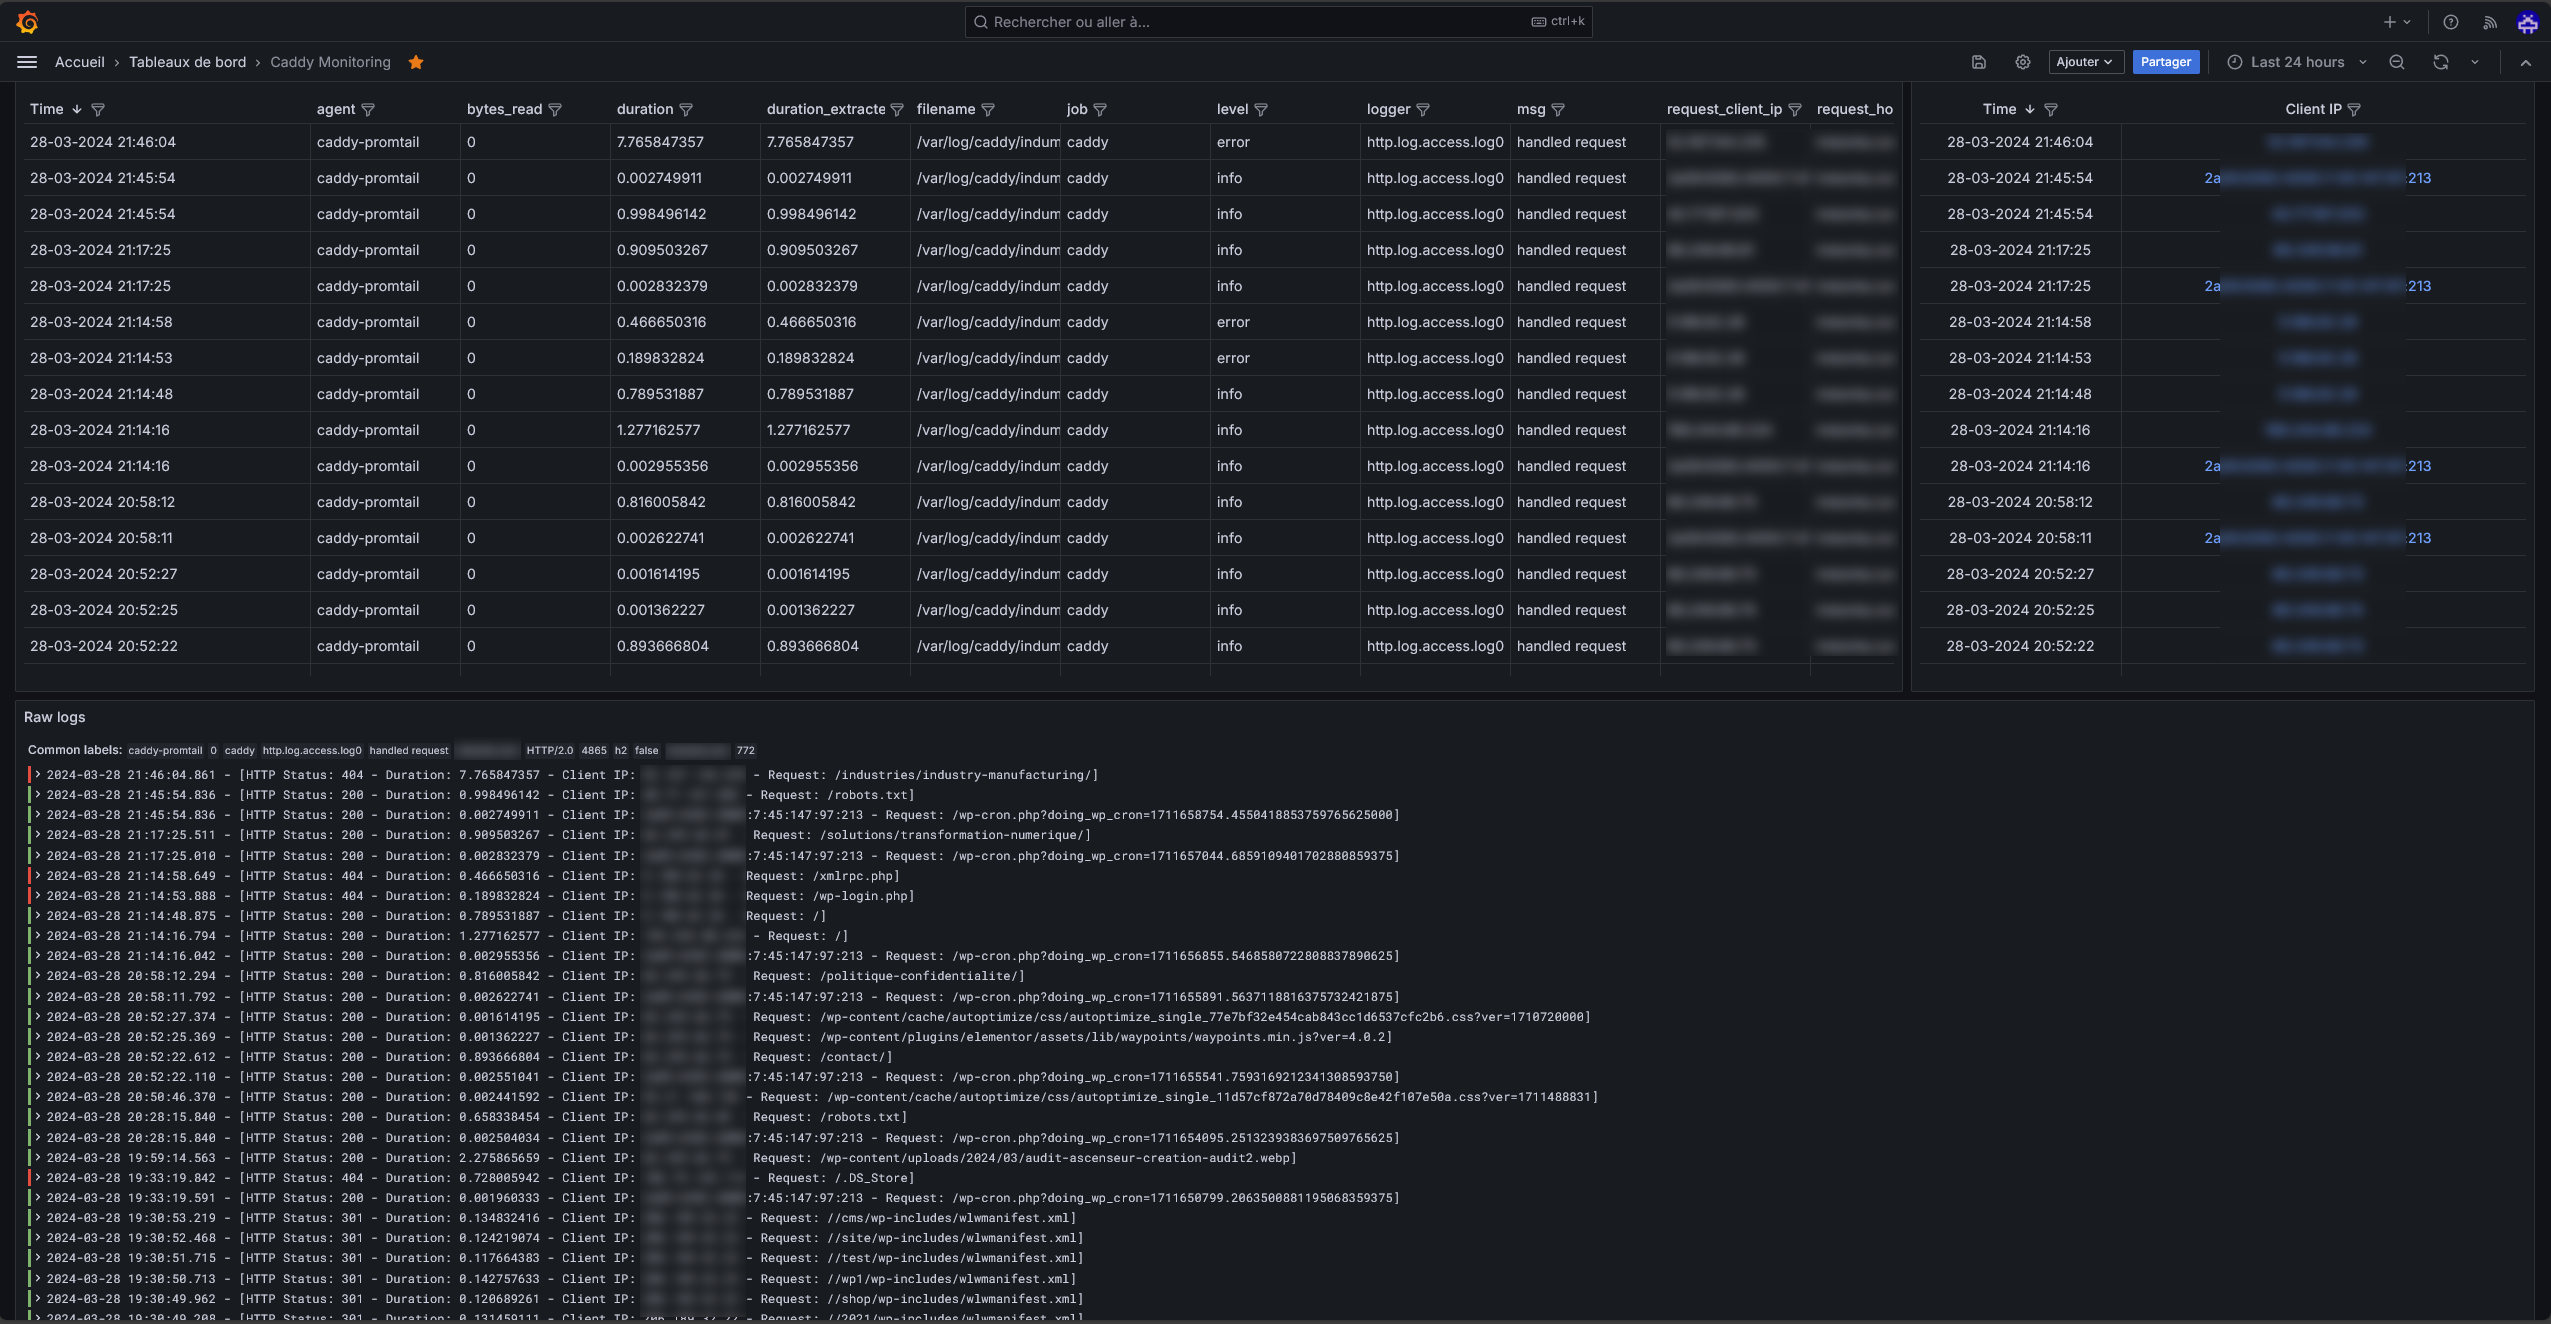
Monitoring Caddy Server with Grafana (Prometheus + Loki)
Screenshots
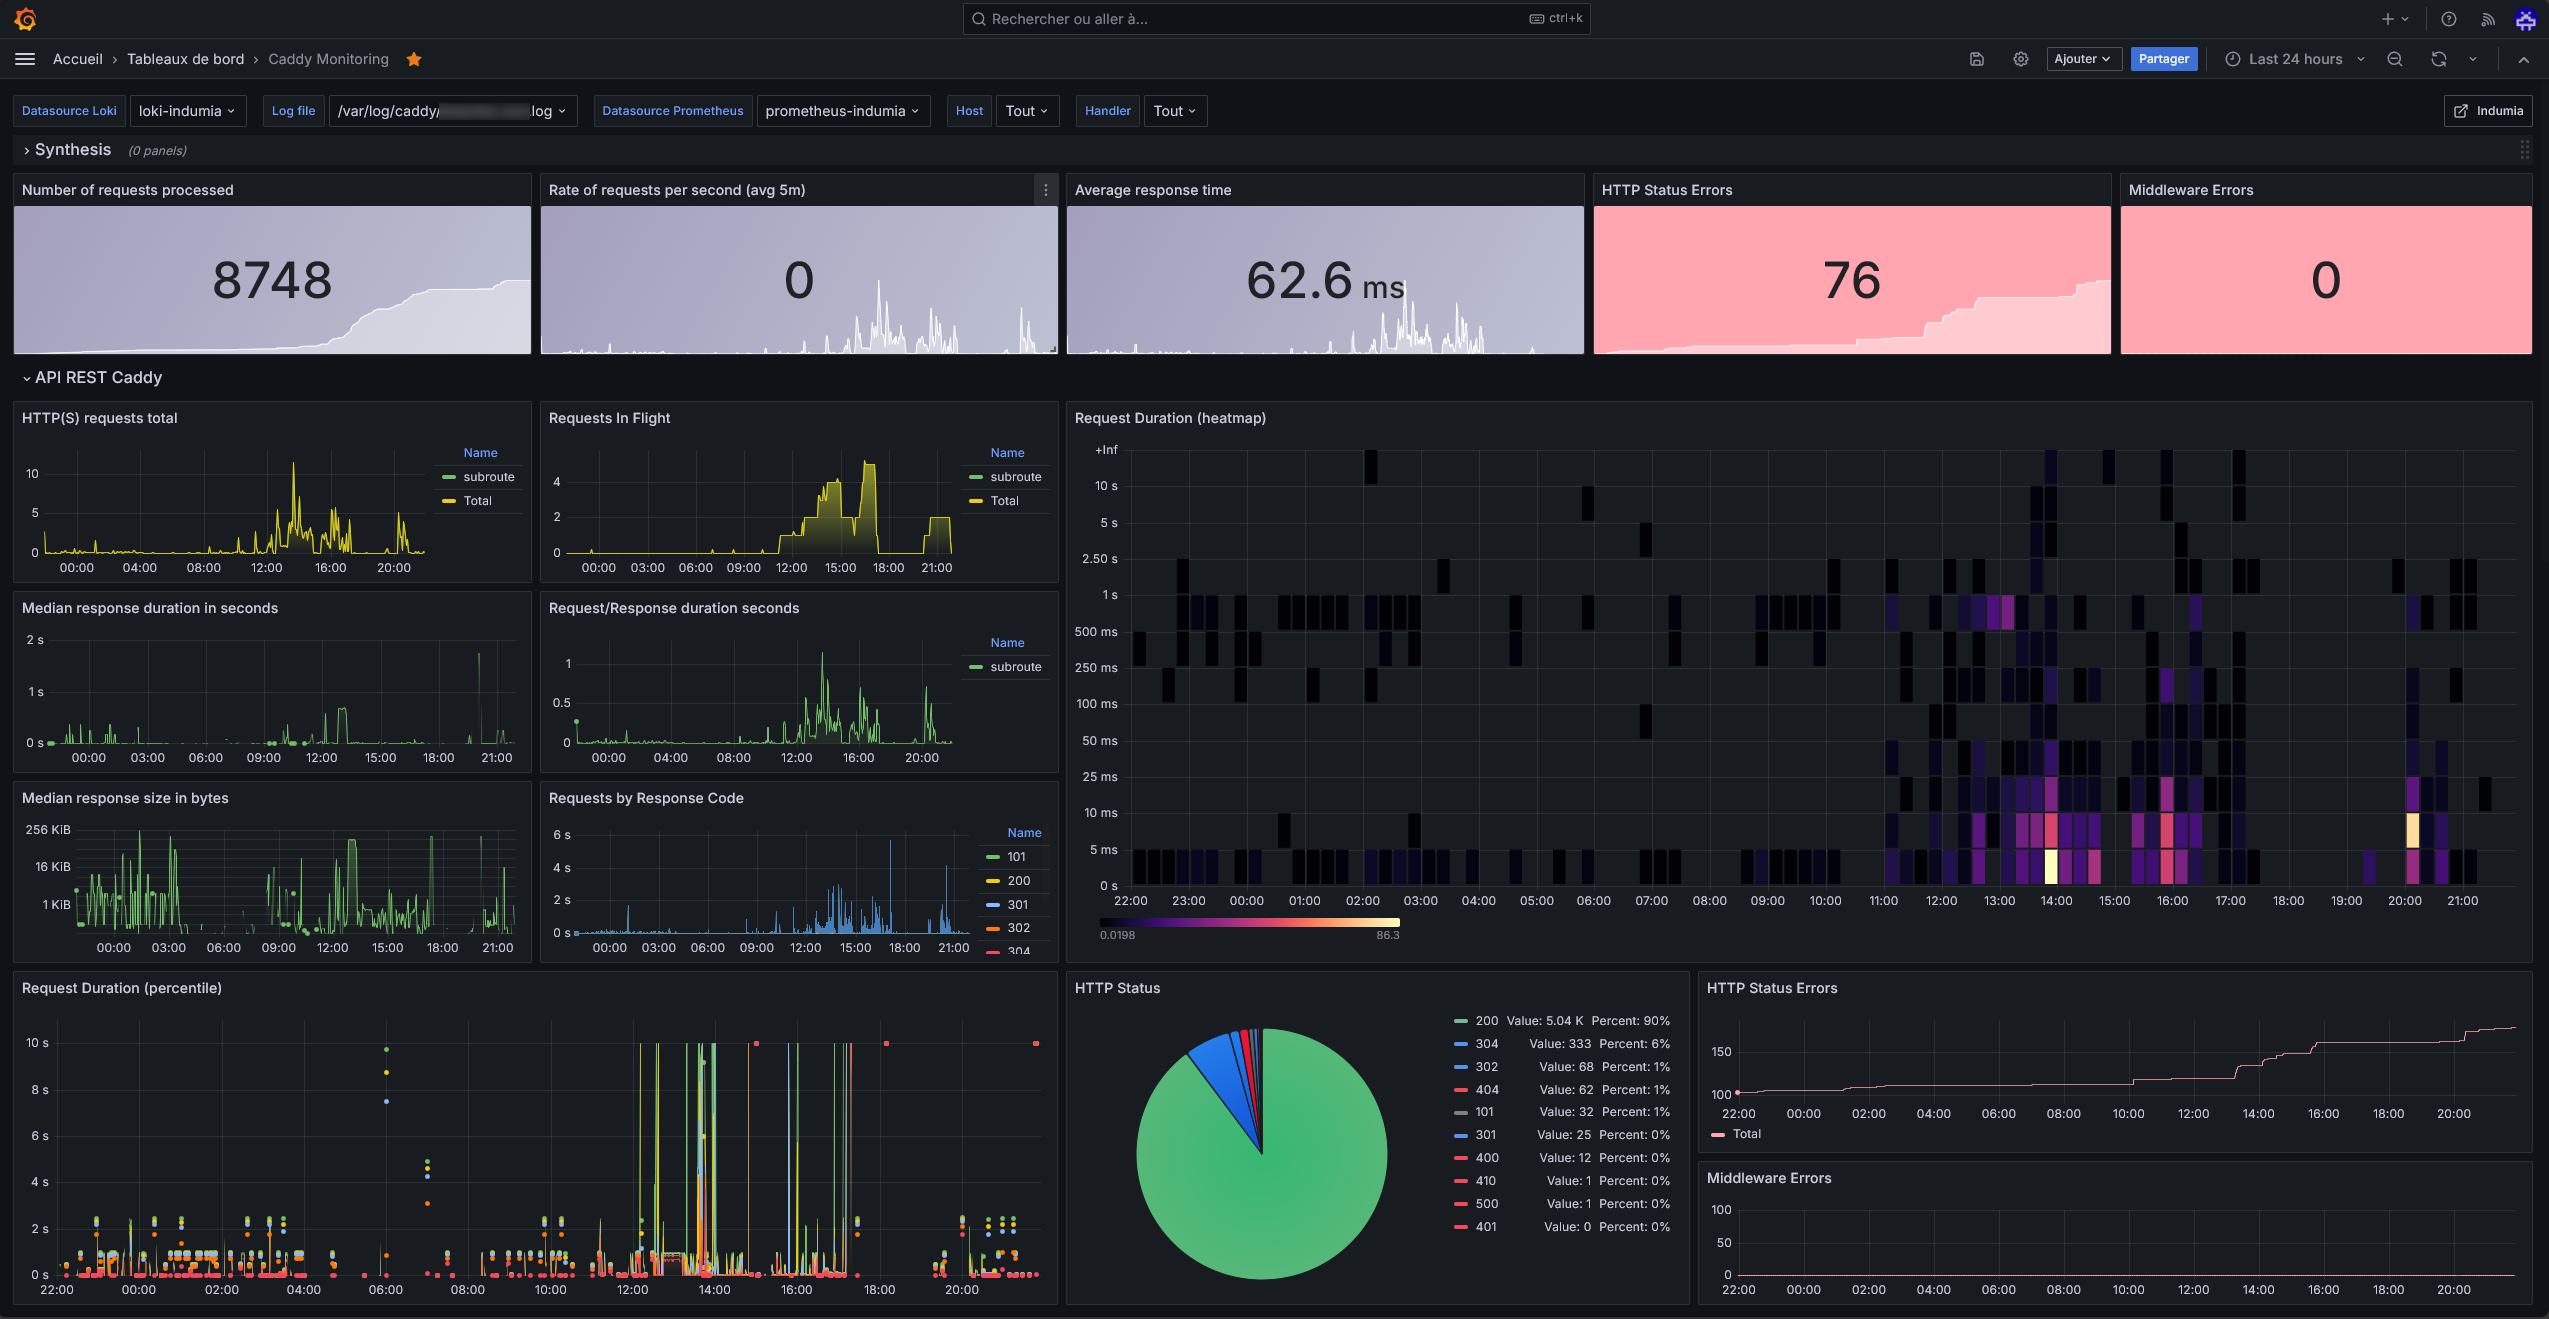
Used Metrics 1515
Client
Duration:
HTTP
IP:
Request:
Status:
caddy_http_request_duration_seconds_bucket
caddy_http_request_duration_seconds_count
caddy_http_request_errors_total
caddy_http_requests_in_flight
caddy_http_requests_total
caddy_http_response_duration_seconds_bucket
caddy_http_response_size_bytes_bucket
json
line_format
Get Dashboard✕
Download
Copy to Clipboard