blocky4 42,96142,961 5.0 (1 reviews)
Description
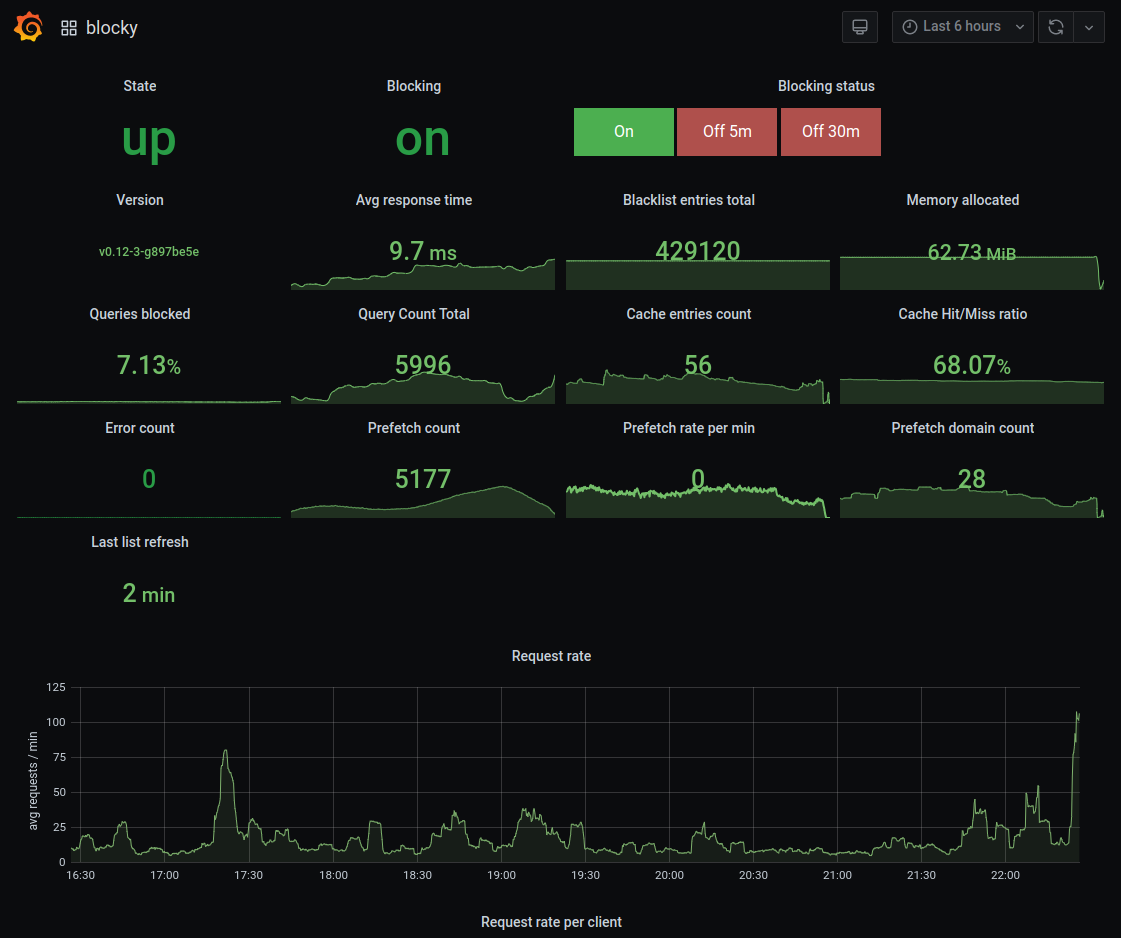
This Grafana dashboard monitors a blocking service with interactive controls to enable or temporarily disable blocking (5 or 30 minutes) via a lightweight REST API, and it tracks operational health and performance. Key metrics include up (service availability), blocky_blocking_enabled (current blocking state), and blocky_request_duration_seconds_count with its corresponding sum to compute latency distributions; the dashboard also surfaces cache and denylist activity such as blocky_denylist_cache_entries and blocky_denylist_cache. Alerts and status indicators are integrated to provide quick feedback on state changes, refresh timing, and request throughput.
Screenshots
Used Metrics 2424
blocky_blocking_enabled
blocky_build_info
blocky_cache_entries
blocky_cache_entry_count
blocky_cache_hits_total
blocky_cache_misses_total
blocky_denylist_cache
blocky_denylist_cache_entries
blocky_error_total
blocky_last_list_group_refresh_timestamp_seconds
blocky_prefetch_count
blocky_prefetch_domain_name_cache_entries
blocky_prefetch_hits_total
blocky_prefetches_total
blocky_query_total
blocky_request_duration_ms_count
blocky_request_duration_ms_sum
blocky_request_duration_seconds_bucket
blocky_request_duration_seconds_count
blocky_request_duration_seconds_sum
blocky_response_total
-
go_memstats_sys_bytes
topk
-
up