Bind DNS 178,429178,429
3/10/2017
3/10/2017
1
Host Metrics
>=4.1.2
Prometheus
Description
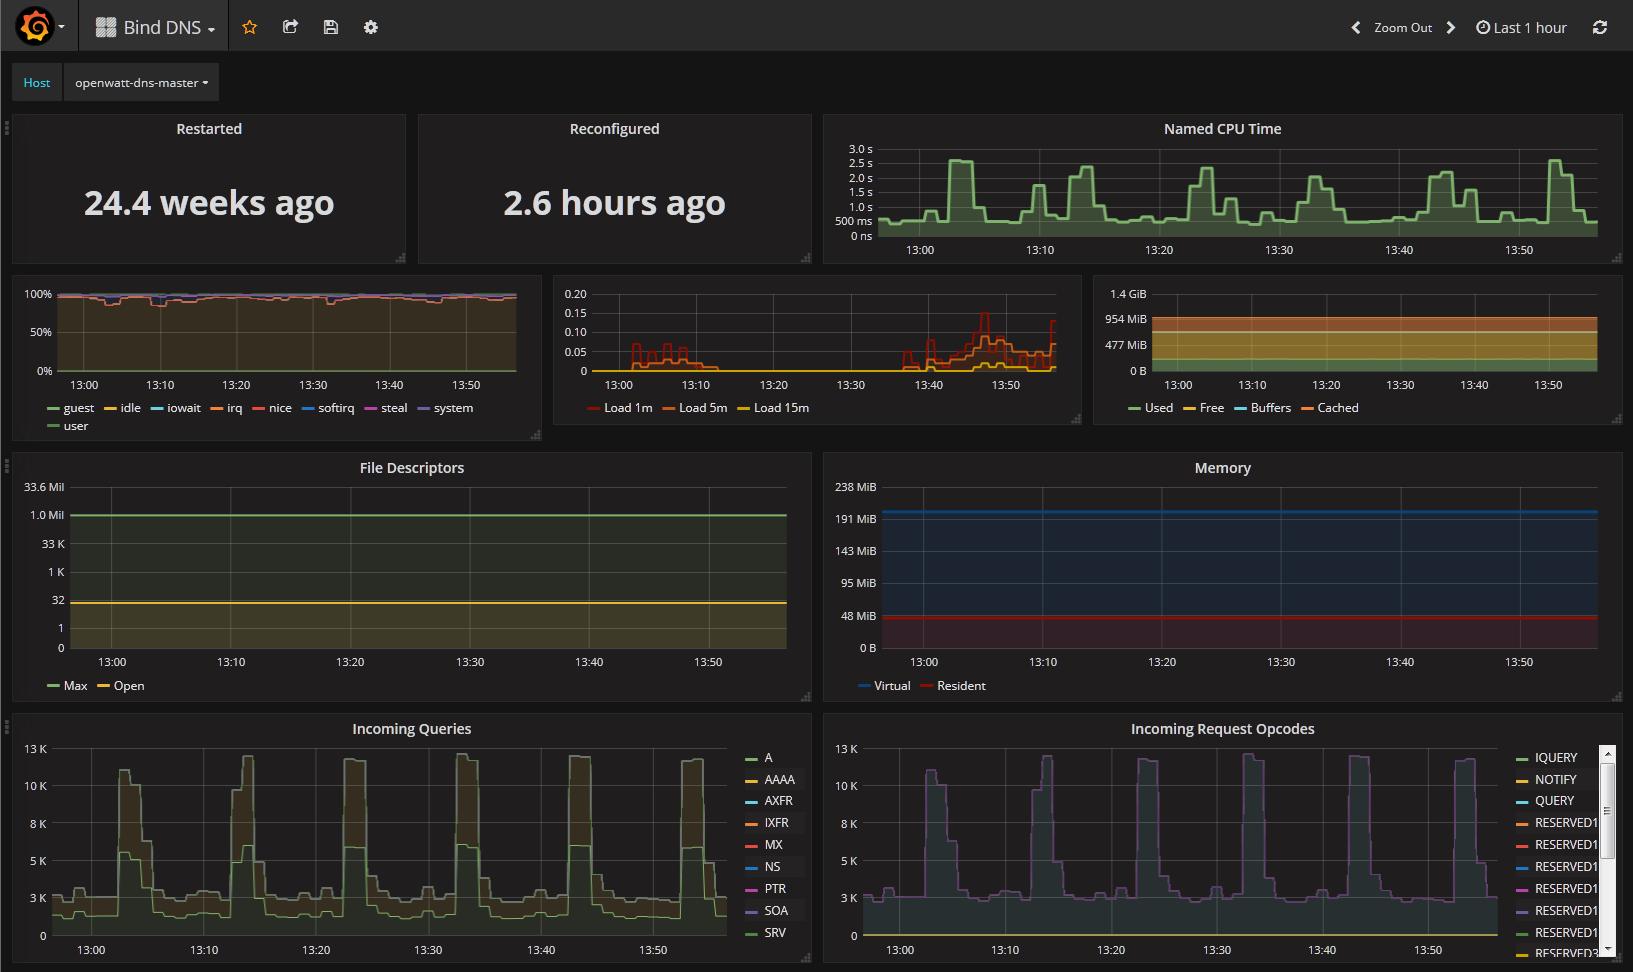
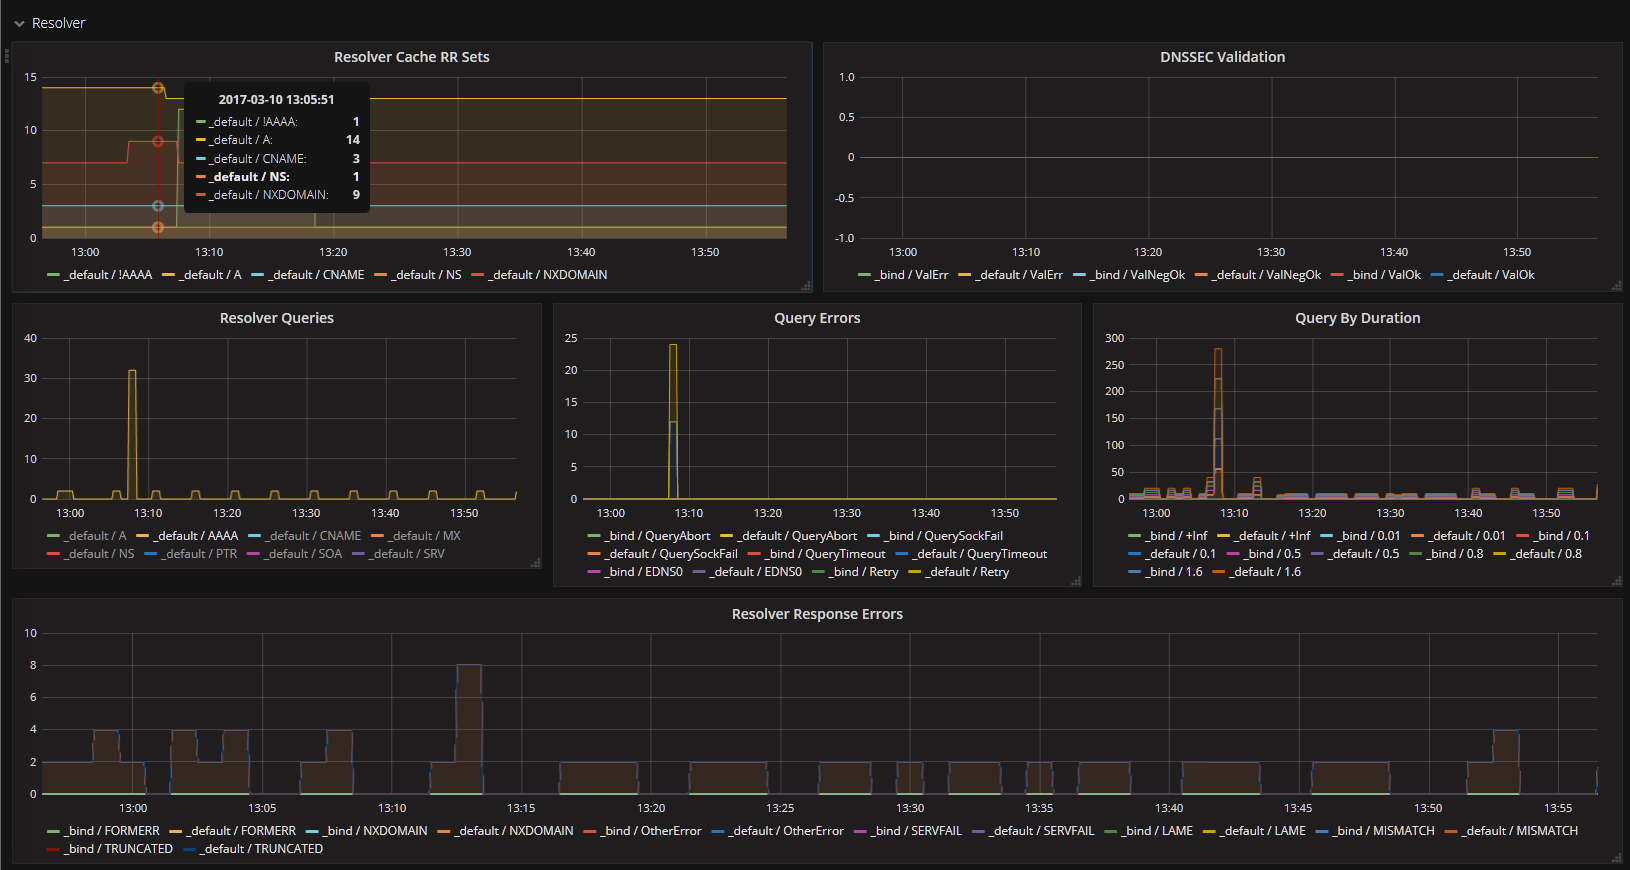
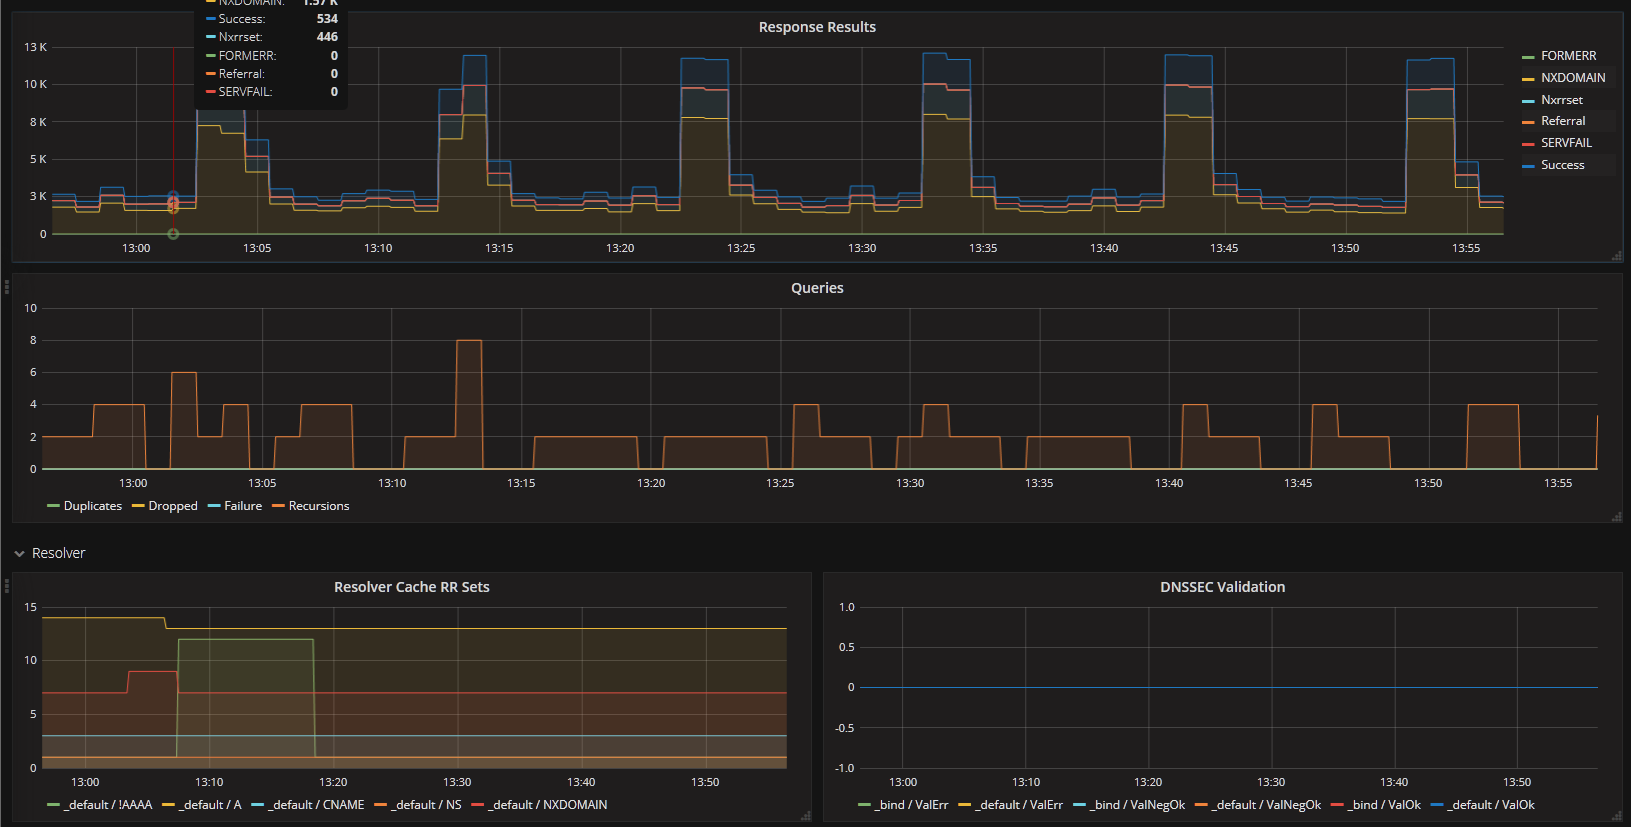
This dashboard monitors a Bind DNS deployment by visualizing key DNS metrics and query health. It highlights query latency, cache hit rate, and zone transfer status to quickly identify performance bottlenecks and reliability issues. Leveraging Prometheus-backed panels, it provides time-series views, alerting-ready thresholds, and drill-downs for individual zones and clients to track DNS resolution behavior and cache effectiveness.
Screenshots
Get Dashboard✕
Download
Copy to Clipboard