Better NVIDIA DCGM Dashboard 2,0862,086
12/12/2024
12/12/2024
1
Host Metrics
>=11.3.0
Prometheus
Description
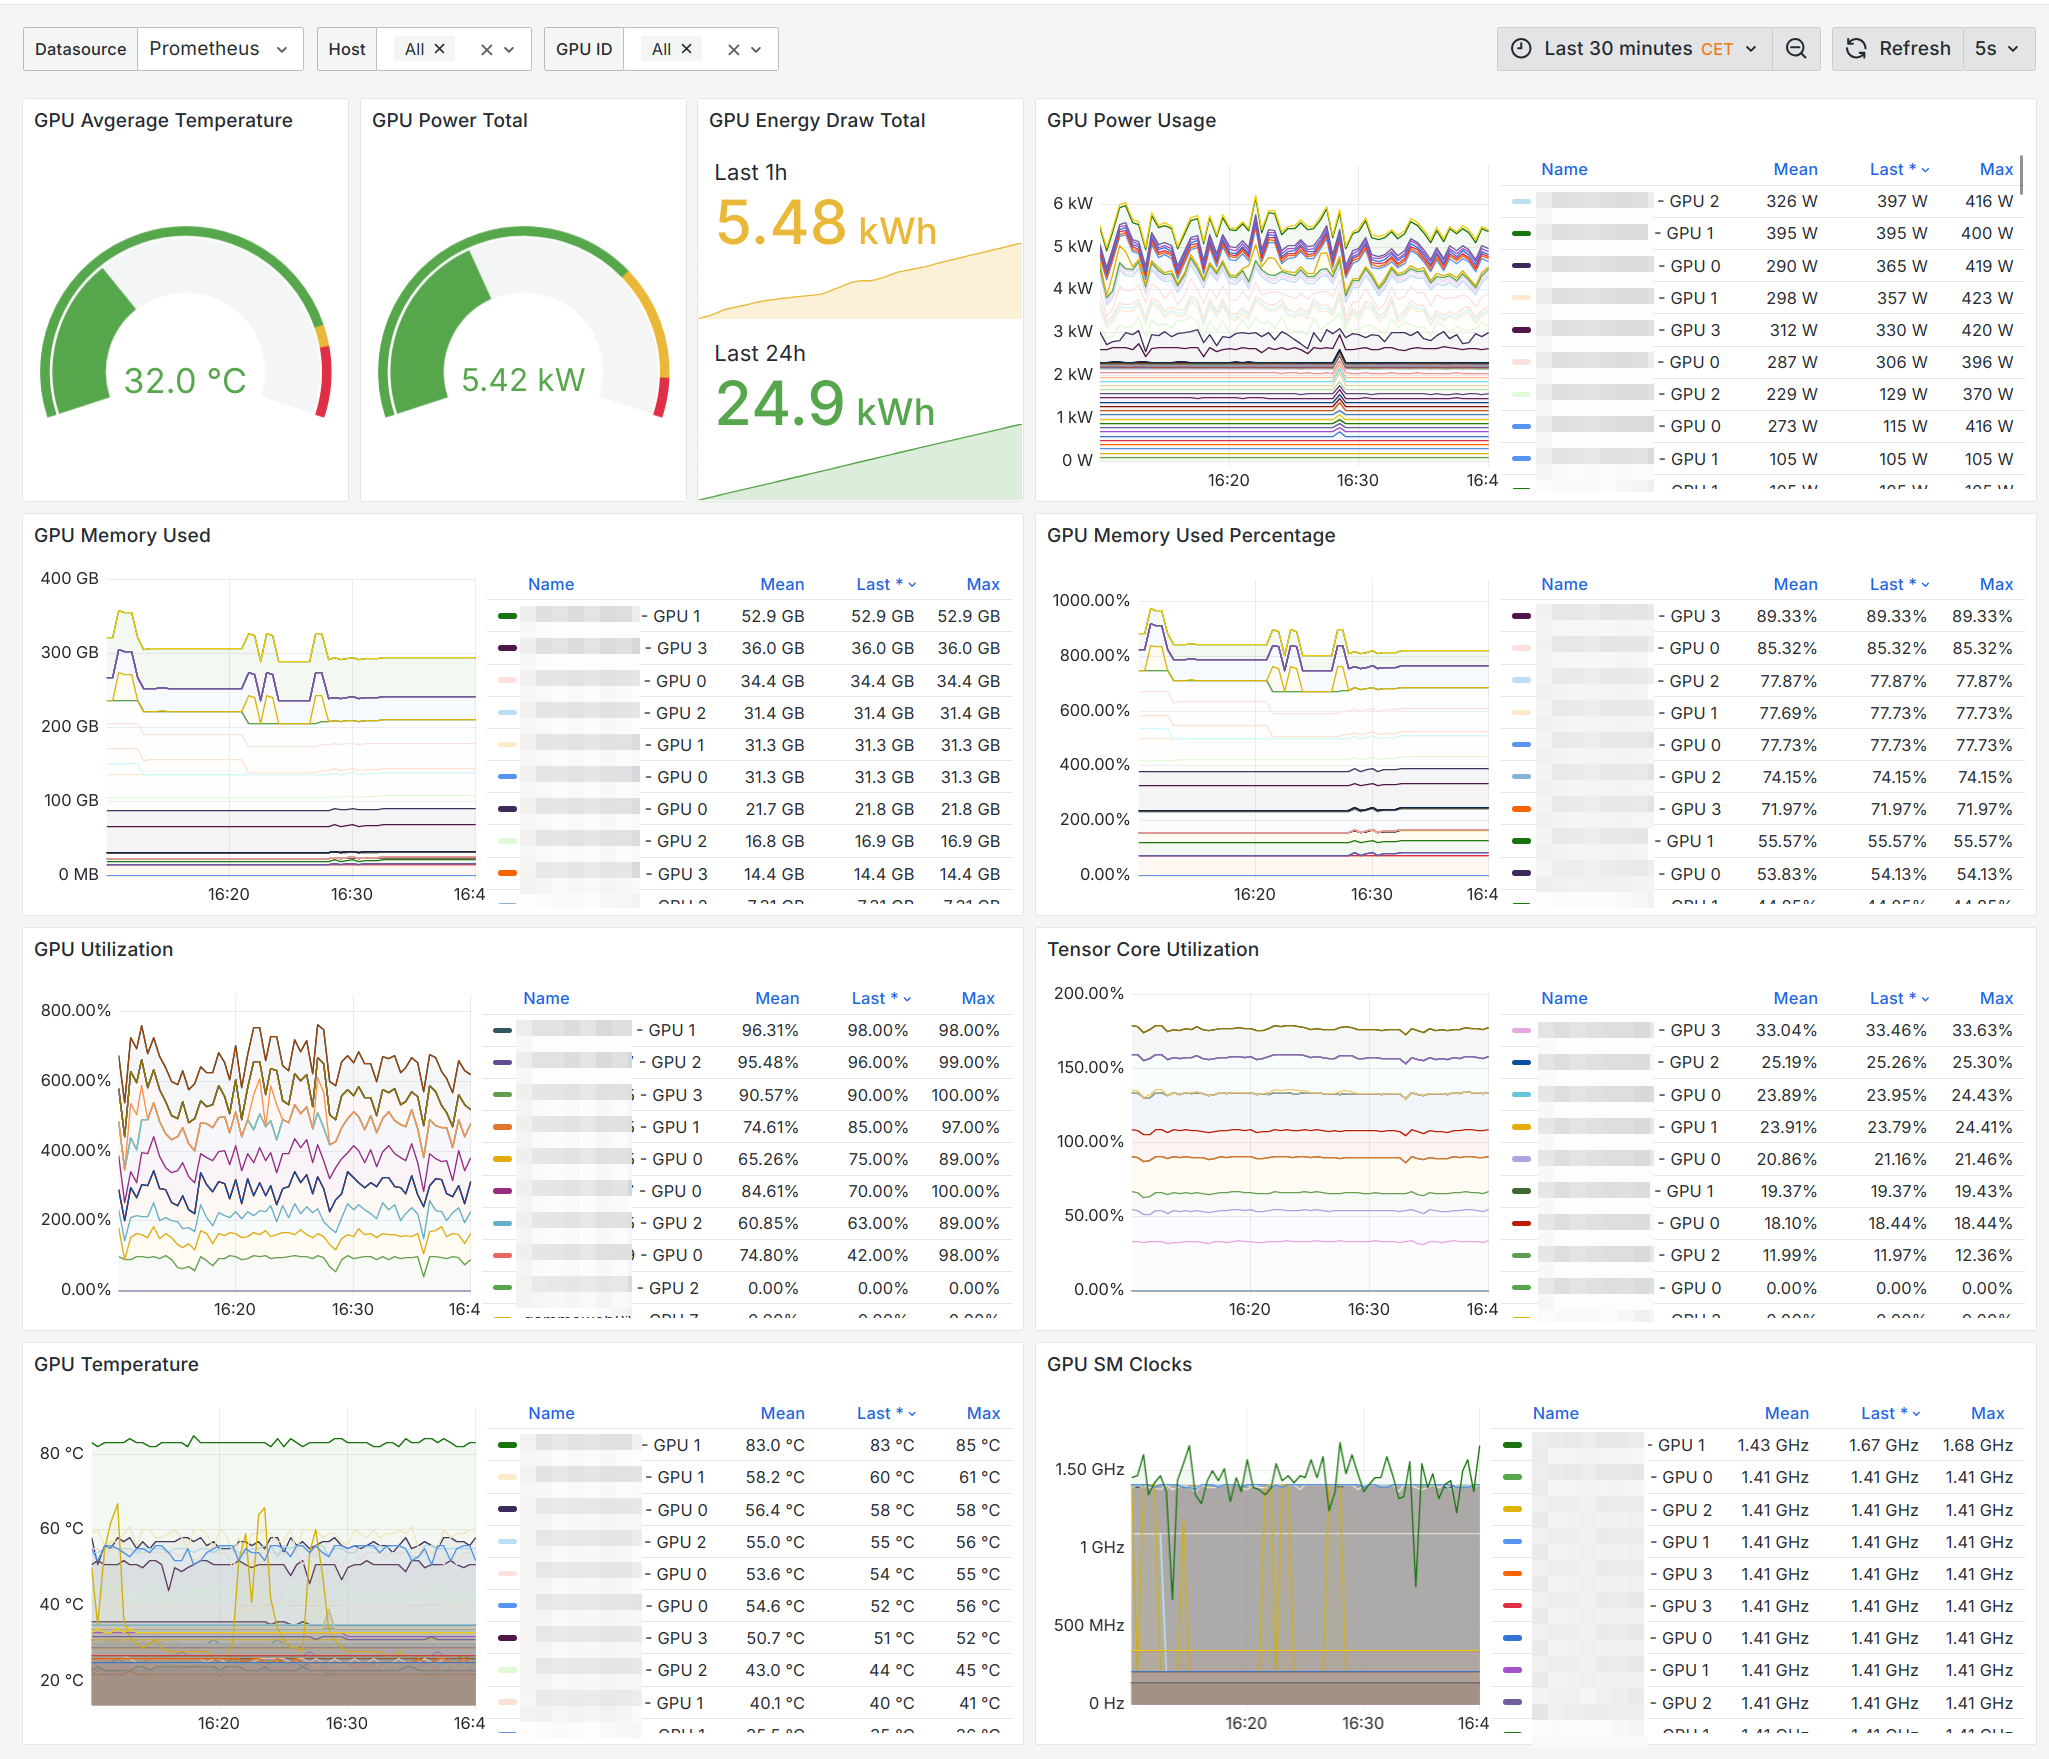
This dashboard displays metrics from a DCGM Exporter on a Kubernetes cluster.
Screenshots
Used Metrics 88
DCGM_FI_DEV_FB_FREE
DCGM_FI_DEV_FB_USED
DCGM_FI_DEV_GPU_TEMP
DCGM_FI_DEV_GPU_UTIL
DCGM_FI_DEV_POWER_USAGE
DCGM_FI_DEV_SM_CLOCK
DCGM_FI_DEV_TOTAL_ENERGY_CONSUMPTION
DCGM_FI_PROF_PIPE_TENSOR_ACTIVE
Get Dashboard✕
Download
Copy to Clipboard