Besu Overview 483,021483,021 5.0 (1 reviews)
Description
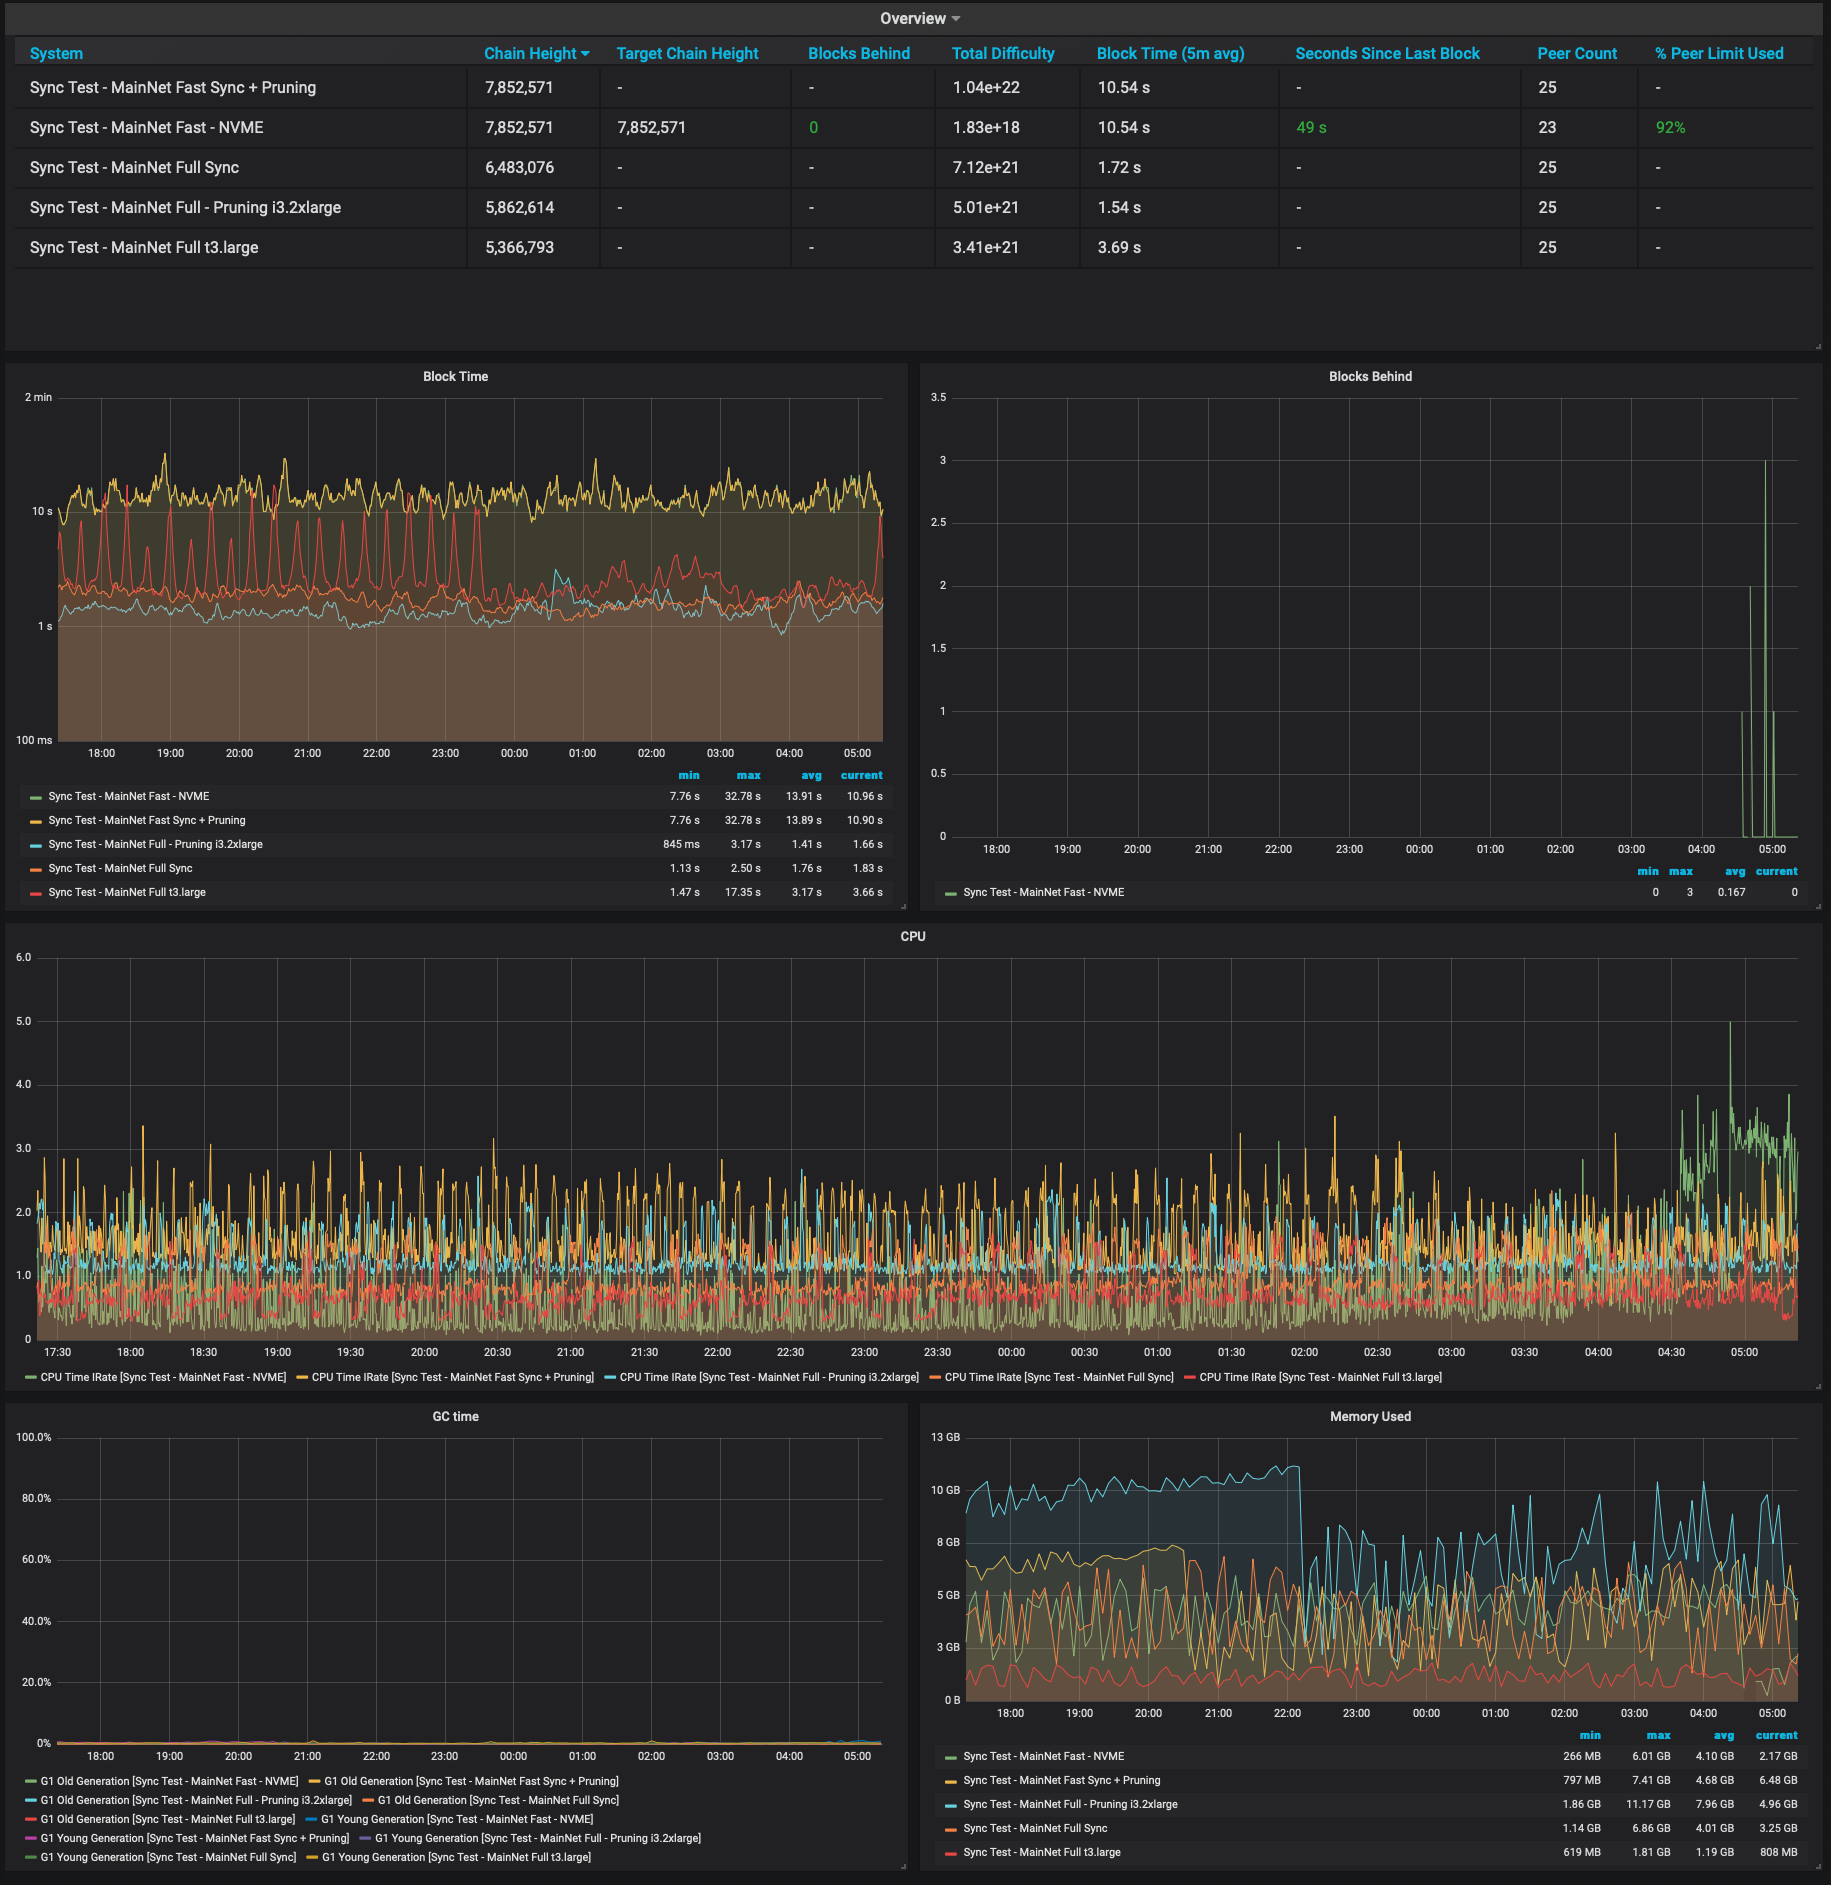
This dashboard provides a concise view of an Ethereum-compatible Besu node’s health and synchronization status, combining blockchain progress, peer activity, and resource usage. It highlights synchronization progress with metrics like besu_synchronizer_best_known_block and ethereum_best_known_block_number, exposes block time and chain head timestamps with besu_blockchain_chain_head_timestamp and related metrics, and tracks resource pressure through CPU, GC time, and Memory Used, along with peer counts and limits via besu_peers_peer_count_current and besu_network_peers_limit / ethereum_peer_limit.
Screenshots
Used Metrics 1616
besu_blockchain_chain_head_timestamp
besu_blockchain_difficulty_total
besu_blockchain_height
besu_network_peers_limit
besu_peers_peer_count_current
besu_synchronizer_best_known_block
besu_synchronizer_fast_sync_pivot_block_current
besu_synchronizer_world_state_completed_requests_total
besu_synchronizer_world_state_pending_requests_current
ethereum_best_known_block_number
ethereum_blockchain_height
ethereum_peer_count
ethereum_peer_limit
jvm_gc_collection_seconds_sum
jvm_memory_bytes_used
-
process_cpu_seconds_total