Besu Full 1,3841,384
6/15/2022
9/23/2025
11
Host Metrics
>=12.0.2
Prometheus
Description
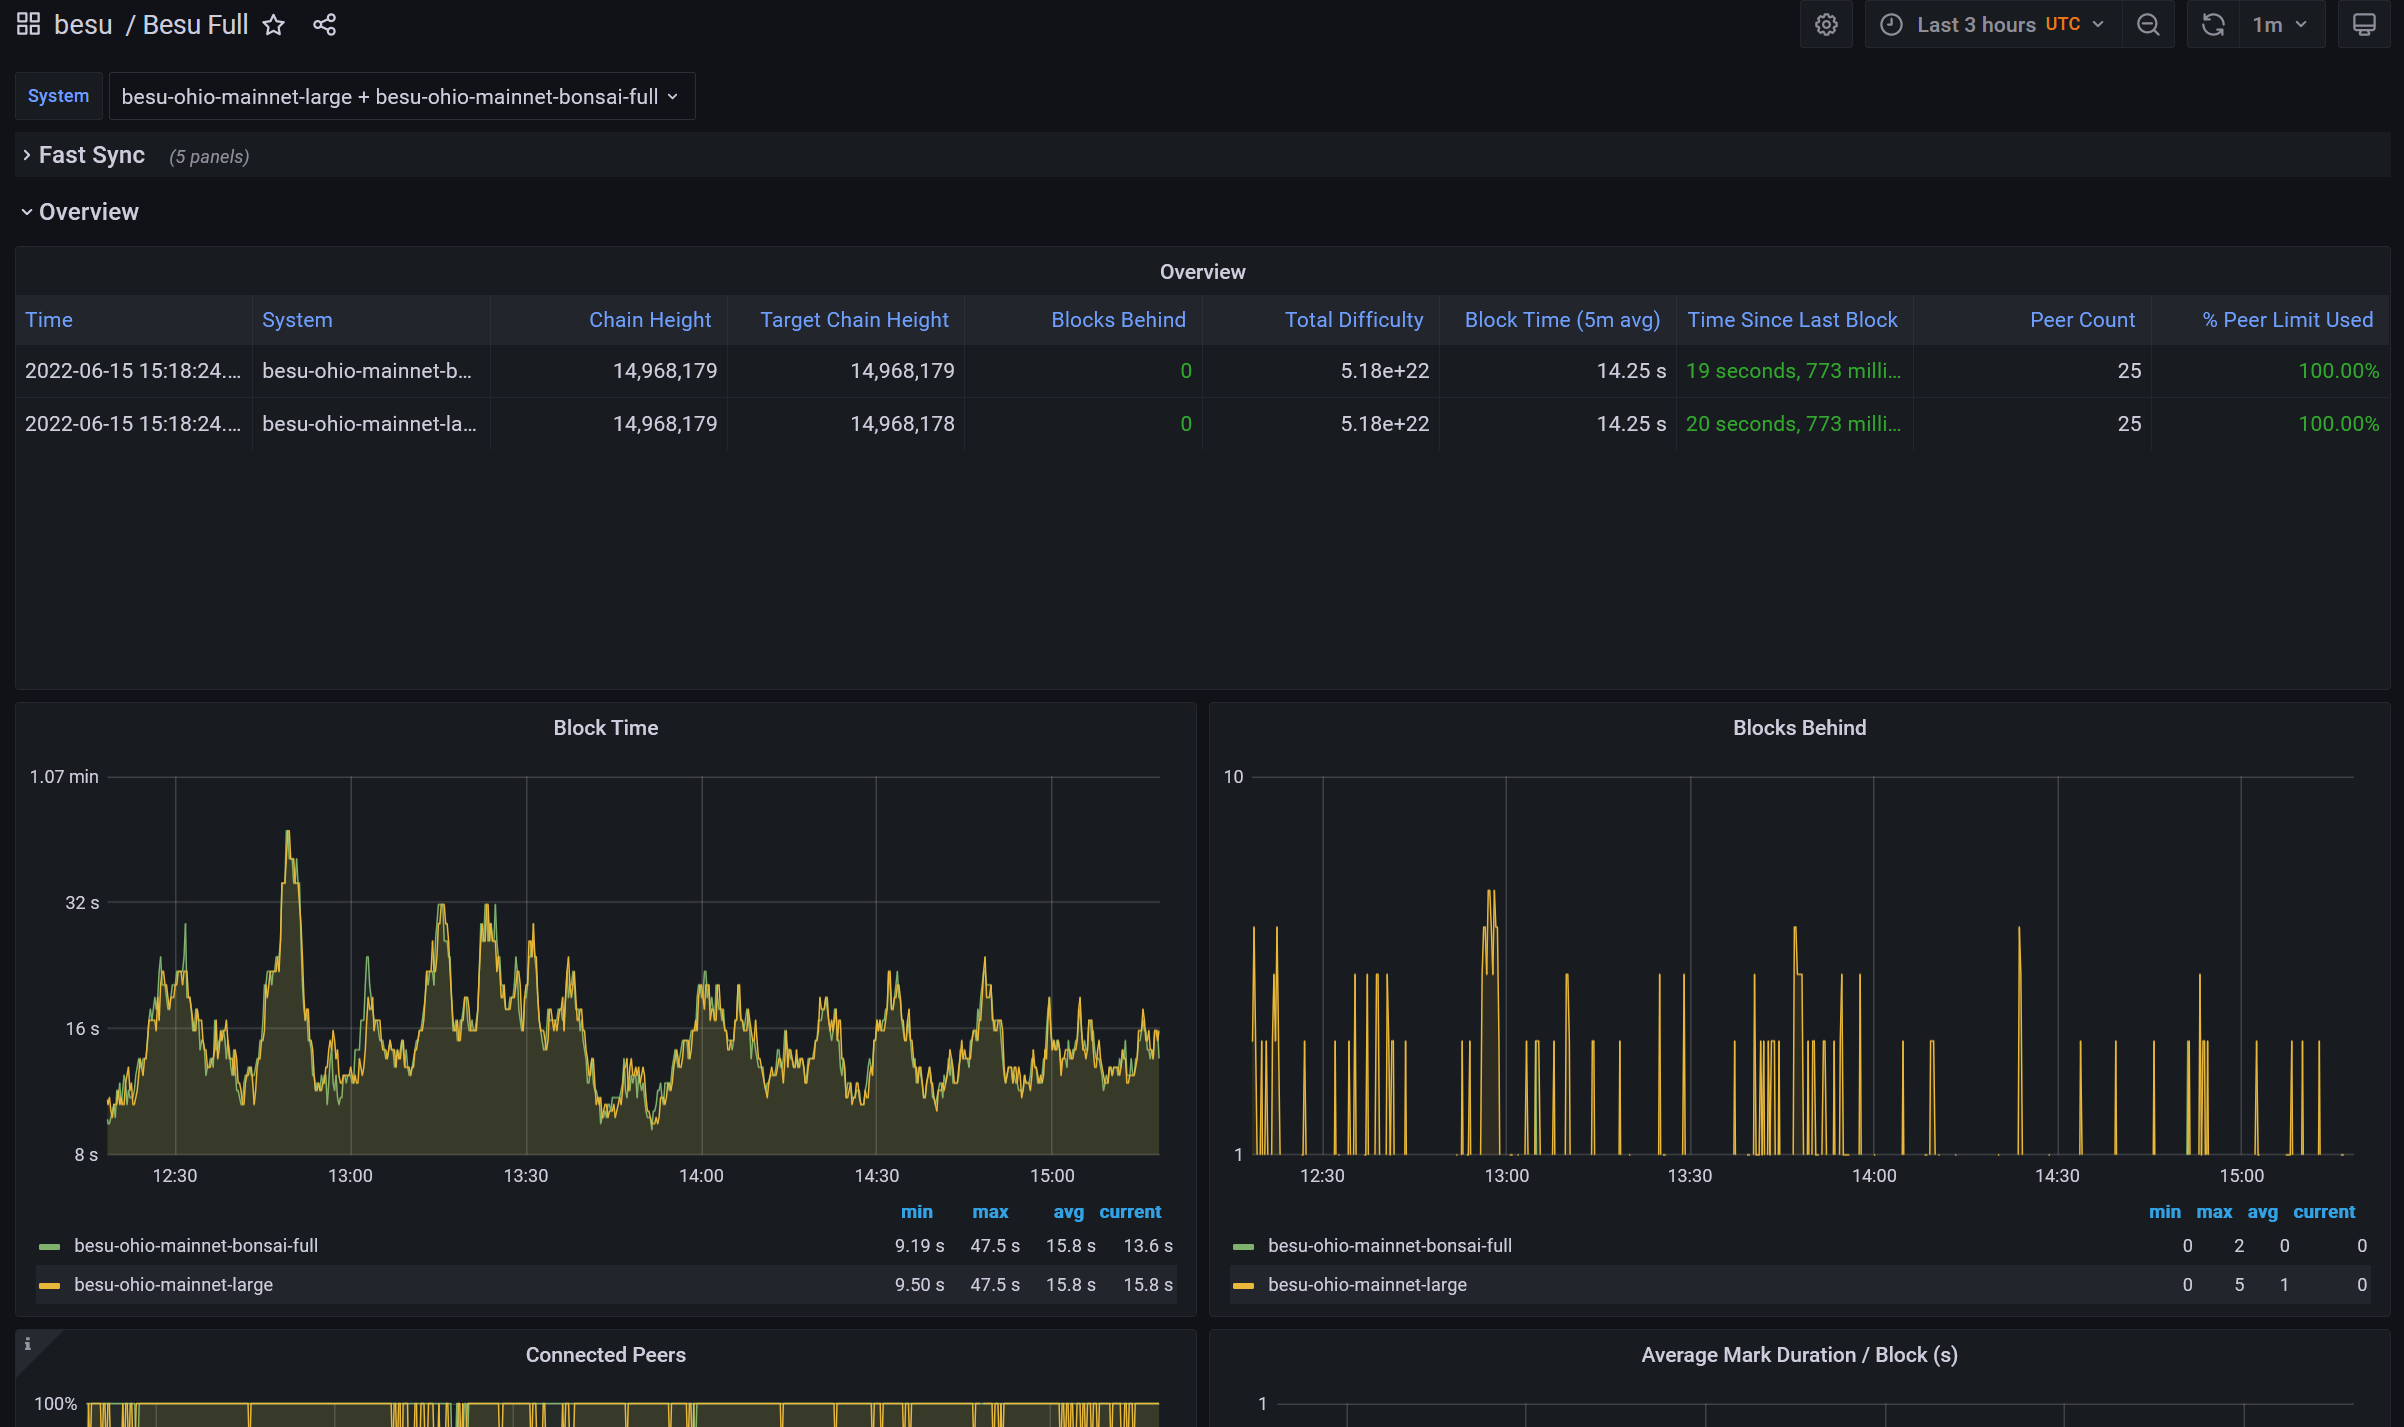
Provides detailed metrics of Besu nodes
Screenshots
Used Metrics 1515
besu_block_processing_conflicted_transactions_counter_total
besu_block_processing_parallelized_transactions_counter_total
besu_blockchain_chain_head_gas_used_counter_total
besu_blockchain_chain_head_timestamp
besu_blockchain_chain_head_transaction_count_counter_total
besu_blockchain_height
besu_network_peers_limit
besu_peer_count
besu_peers_peer_count_current
besu_synchronizer_best_known_block
besu_synchronizer_in_sync
ethereum_best_known_block_number
ethereum_blockchain_height
ethereum_peer_count
ethereum_peer_limit
Get Dashboard✕
Download
Copy to Clipboard