Azure Network Policy Manager Configuration (Prometheus Server) 1,3331,333
9/15/2020
9/22/2020
1
Host Metrics
>=7.1.5
Prometheus
Description
Monitor and understand your Network Configuration. Uses a Prometheus Server data source.
Screenshots
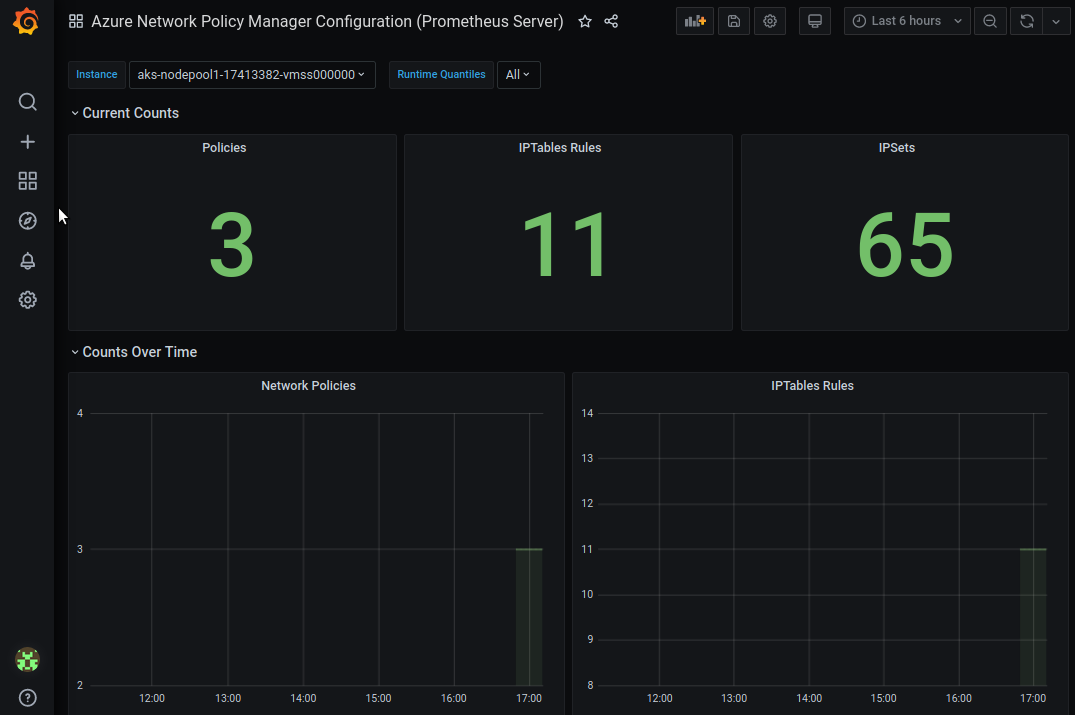
Used Metrics 88
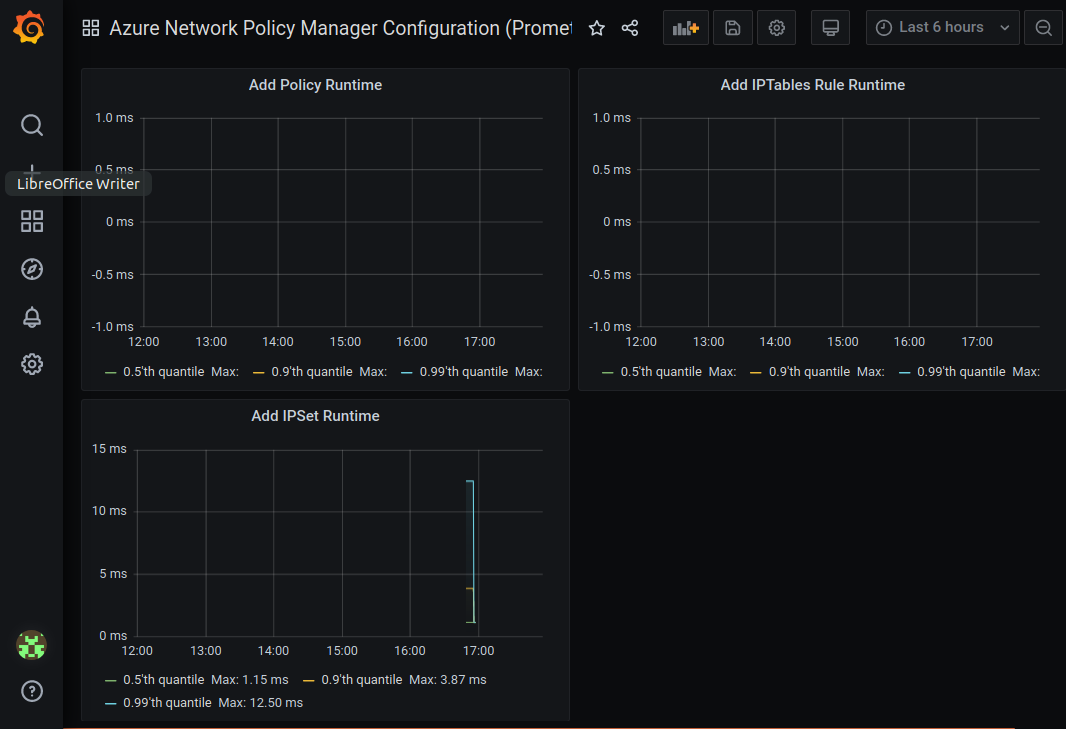
npm_add_ipset_exec_time
npm_add_iptables_rule_exec_time
npm_add_policy_exec_time
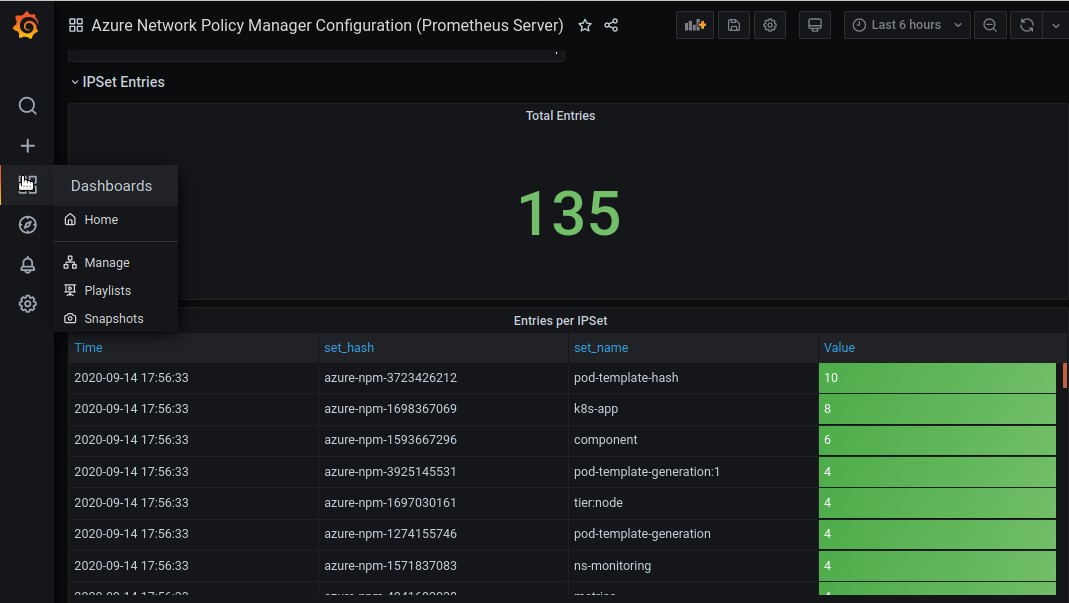
npm_ipset_counts
npm_num_ipset_entries
npm_num_ipsets
npm_num_iptables_rules
npm_num_policies
Get Dashboard✕
Download
Copy to Clipboard