Axon Framework Application 5,5005,500 5.0 (1 reviews)
9/7/2020
5/17/2021
1
Host Metrics
>=7.0.1
Prometheus
Description
Dashboard for Axon Framework Application (micrometer-prometheus).
Screenshots
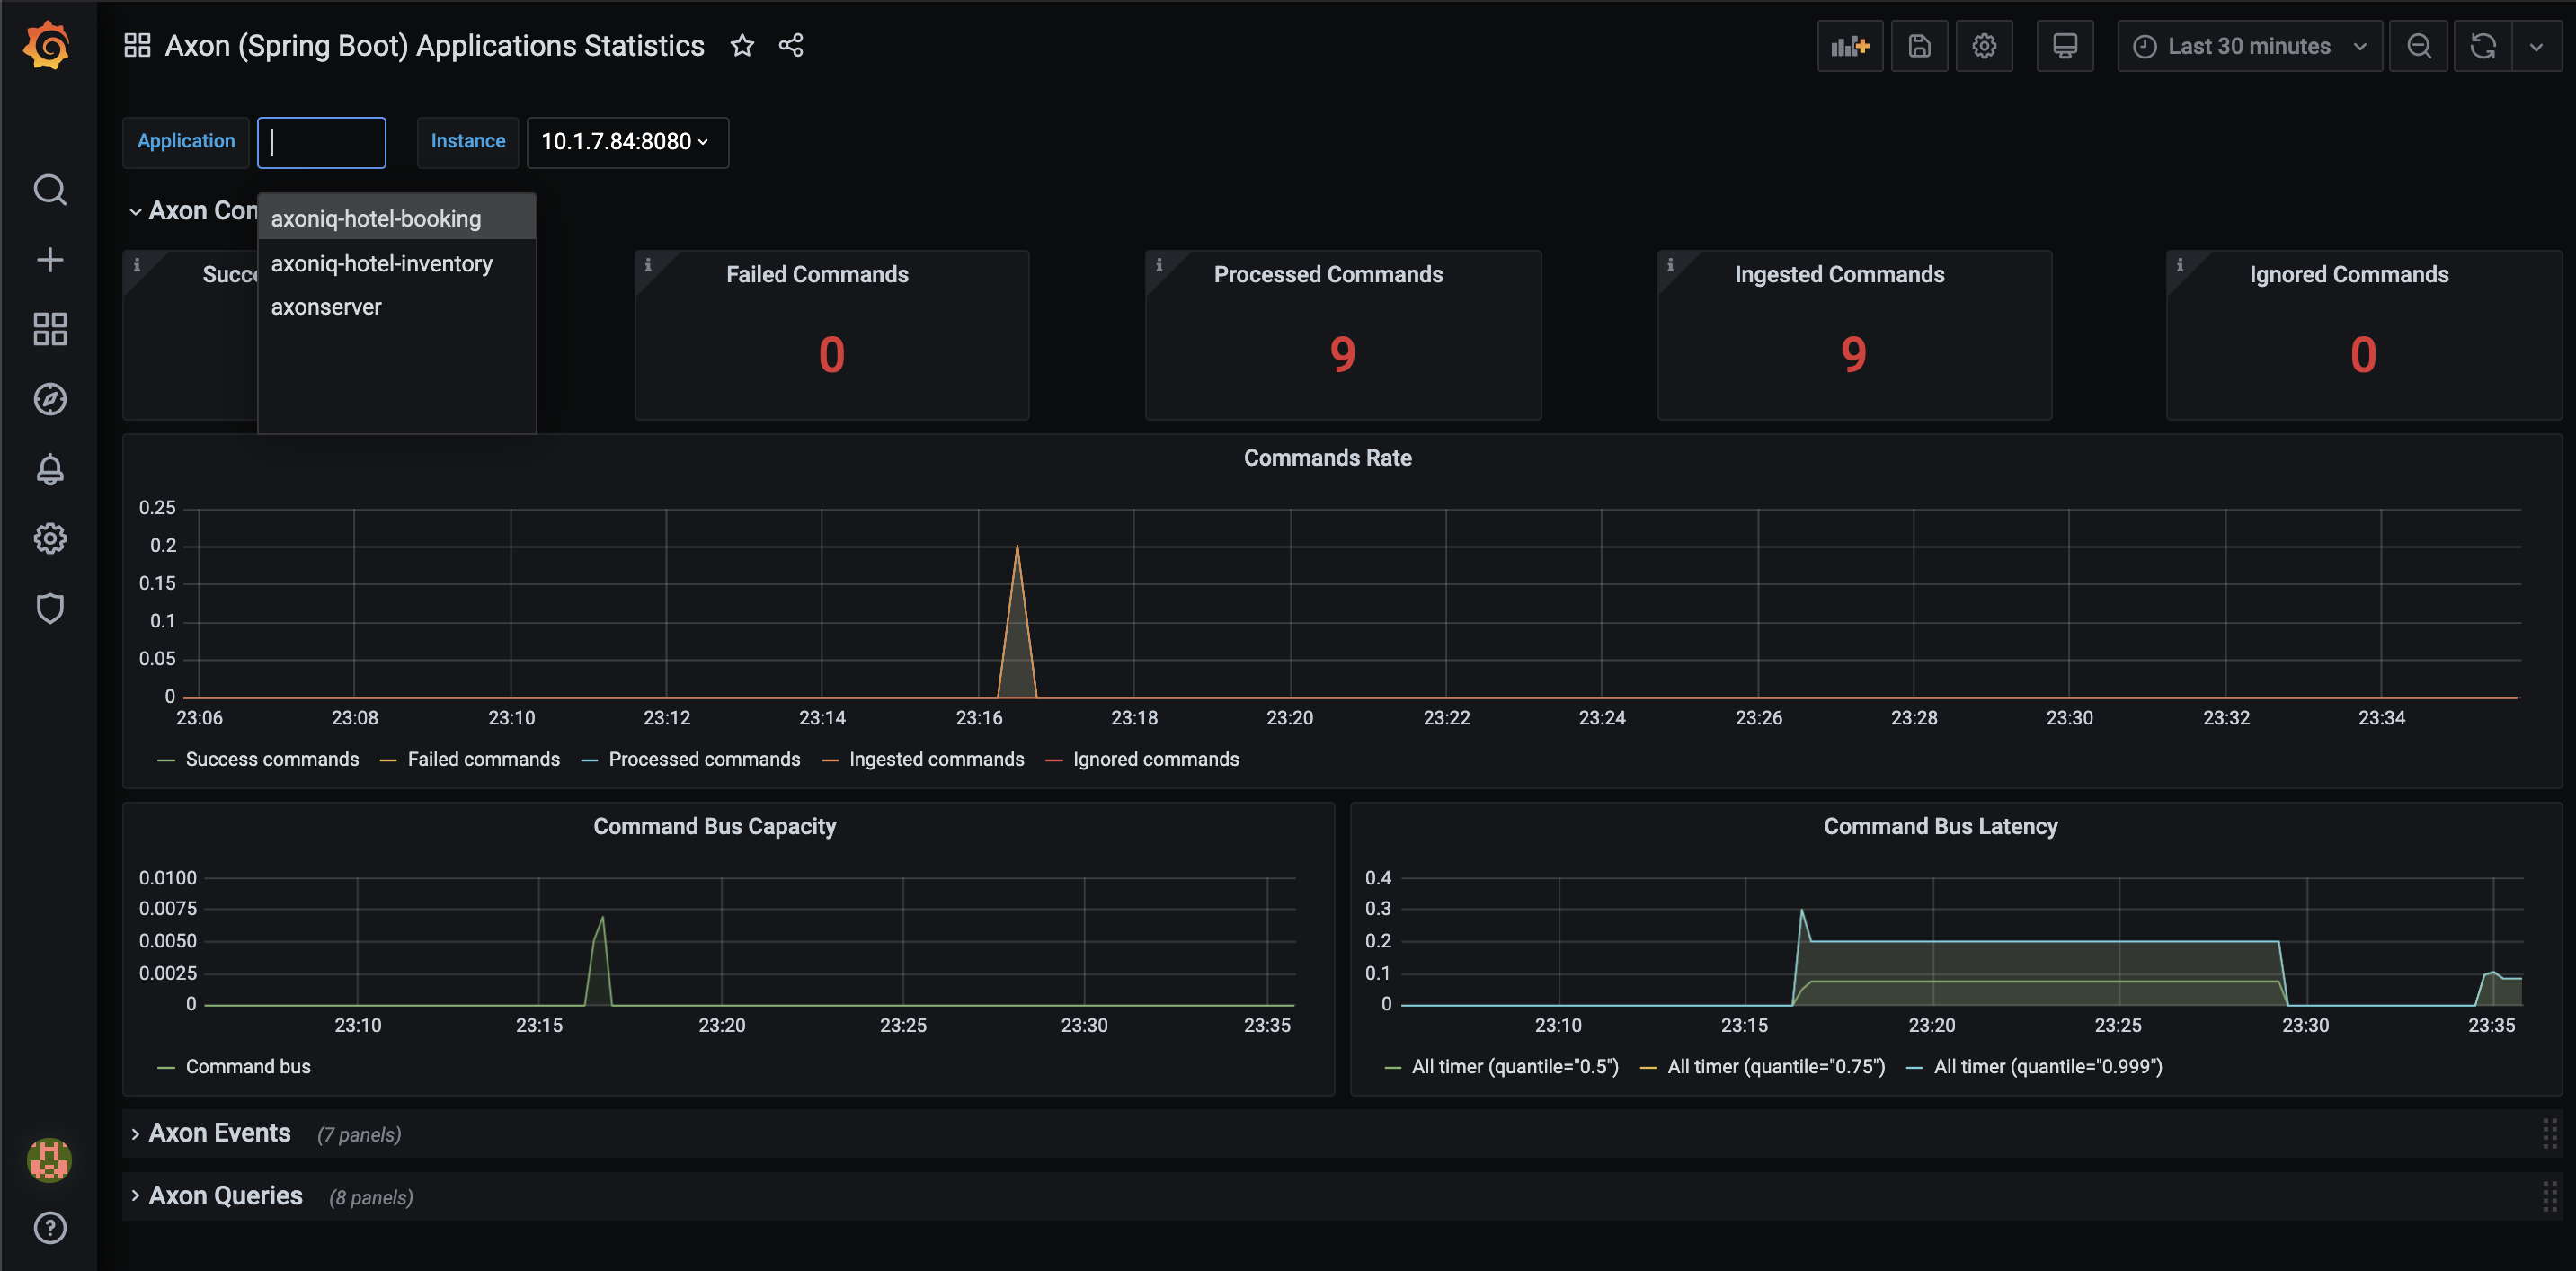
Used Metrics 2020
commandBus_allTimer_seconds
commandBus_capacity
commandBus_failureCounter_total
commandBus_ignoredCounter_total
commandBus_ingestedCounter_total
commandBus_processedCounter_total
commandBus_successCounter_total
eventStore_allTimer_seconds
eventStore_failureCounter_total
eventStore_ignoredCounter_total
eventStore_ingestedCounter_total
eventStore_processedCounter_total
eventStore_successCounter_total
queryBus_allTimer_seconds
queryBus_capacity
queryBus_failureCounter_total
queryBus_ignoredCounter_total
queryBus_ingestedCounter_total
queryBus_processedCounter_total
queryBus_successCounter_total
Get Dashboard✕
Download
Copy to Clipboard