AWS Load Balancer Controller 4,049,8684,049,868
Description
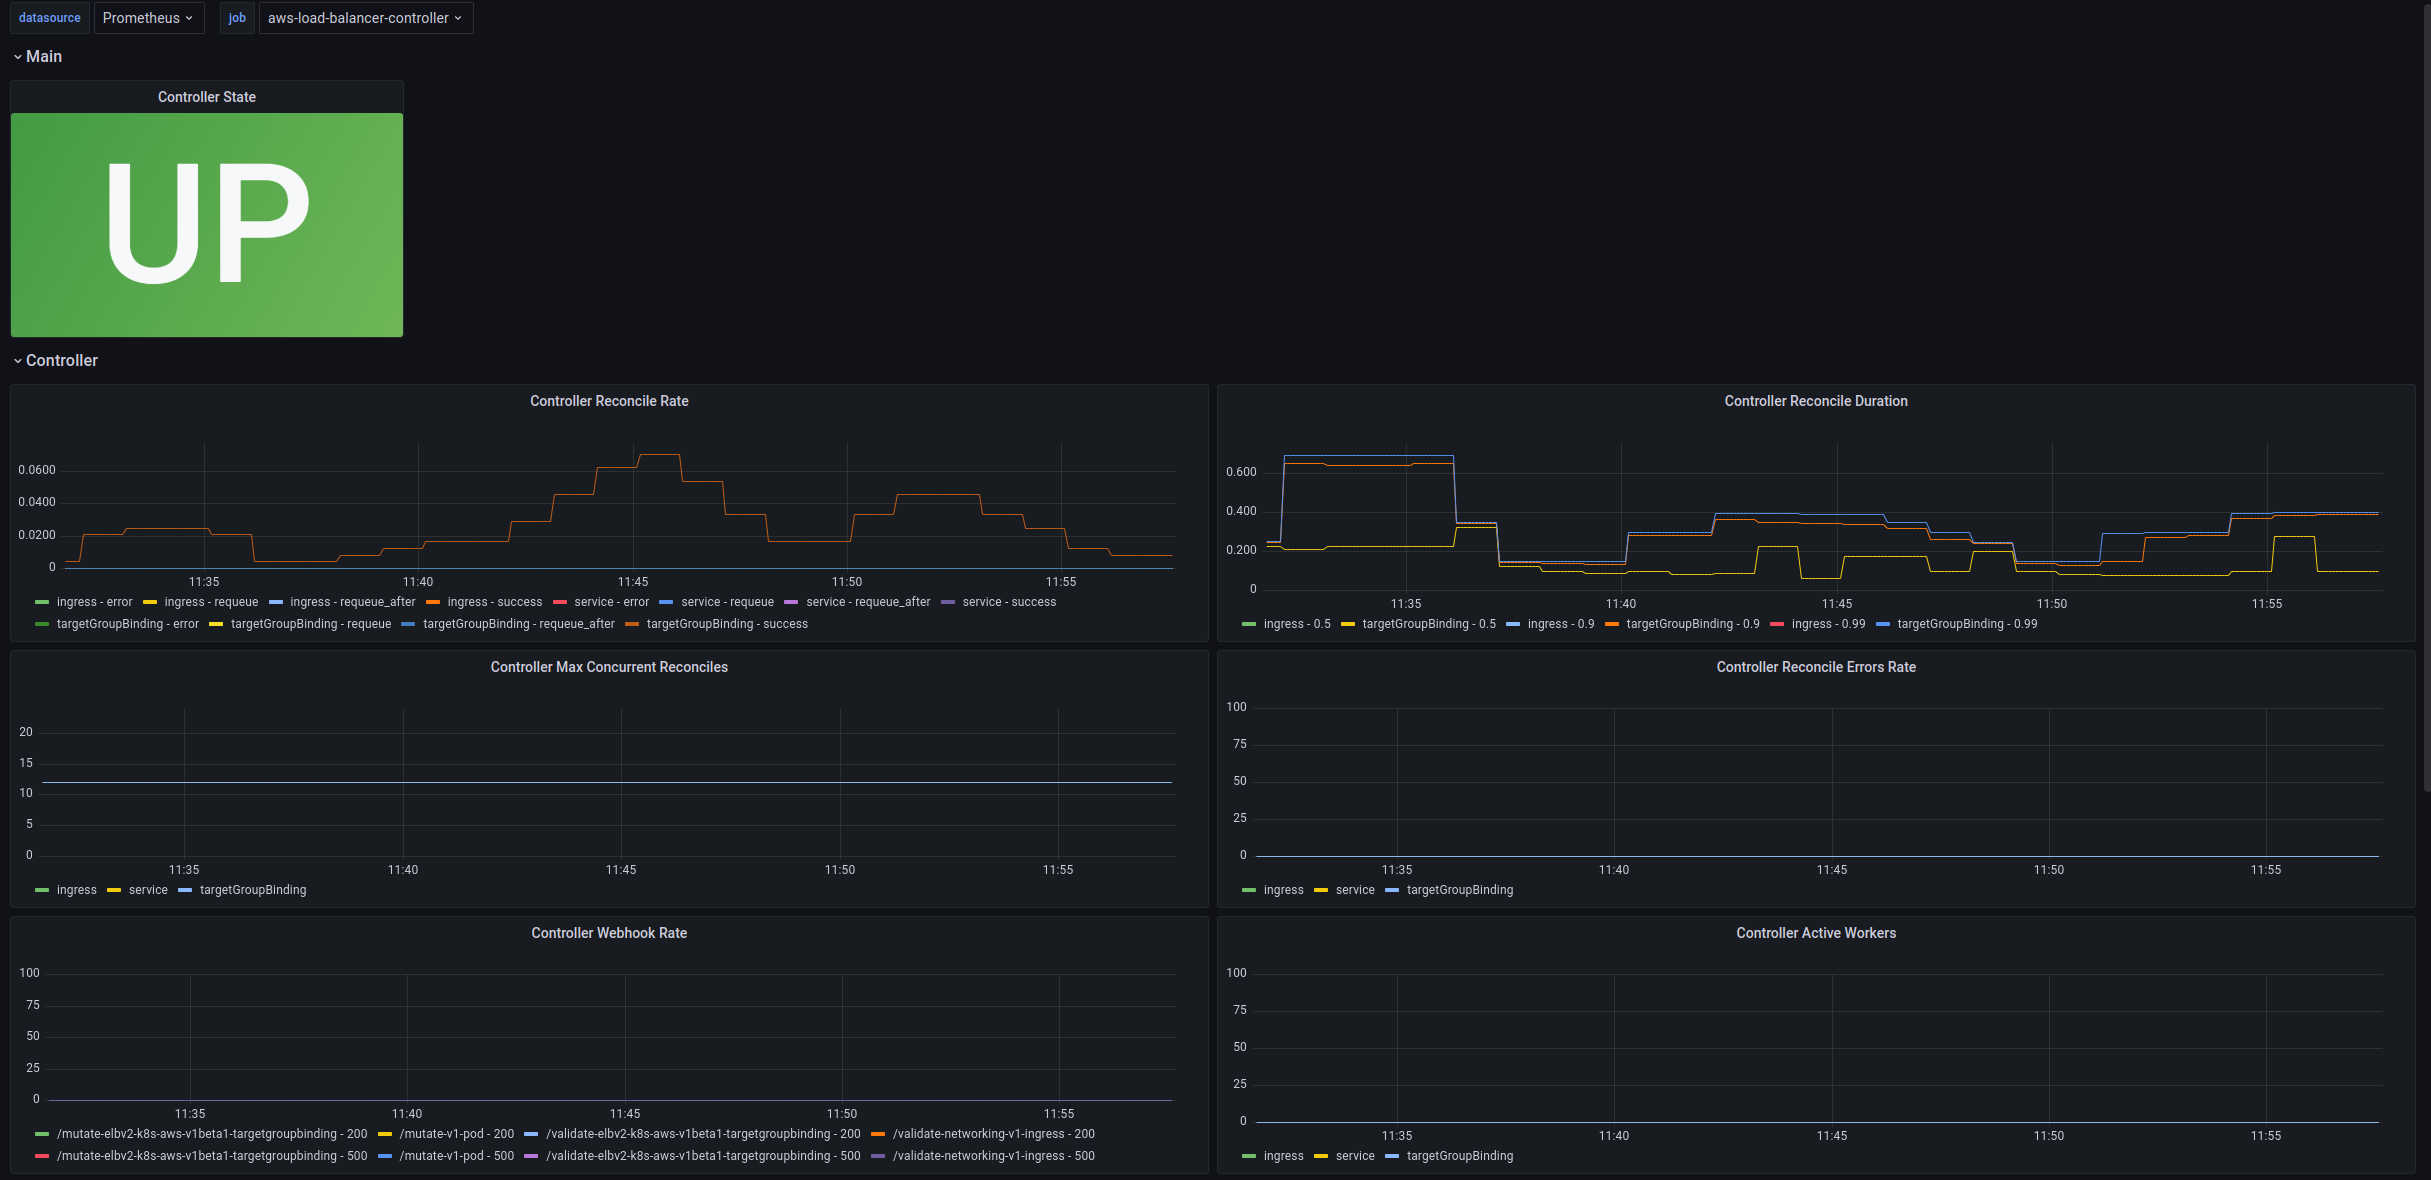
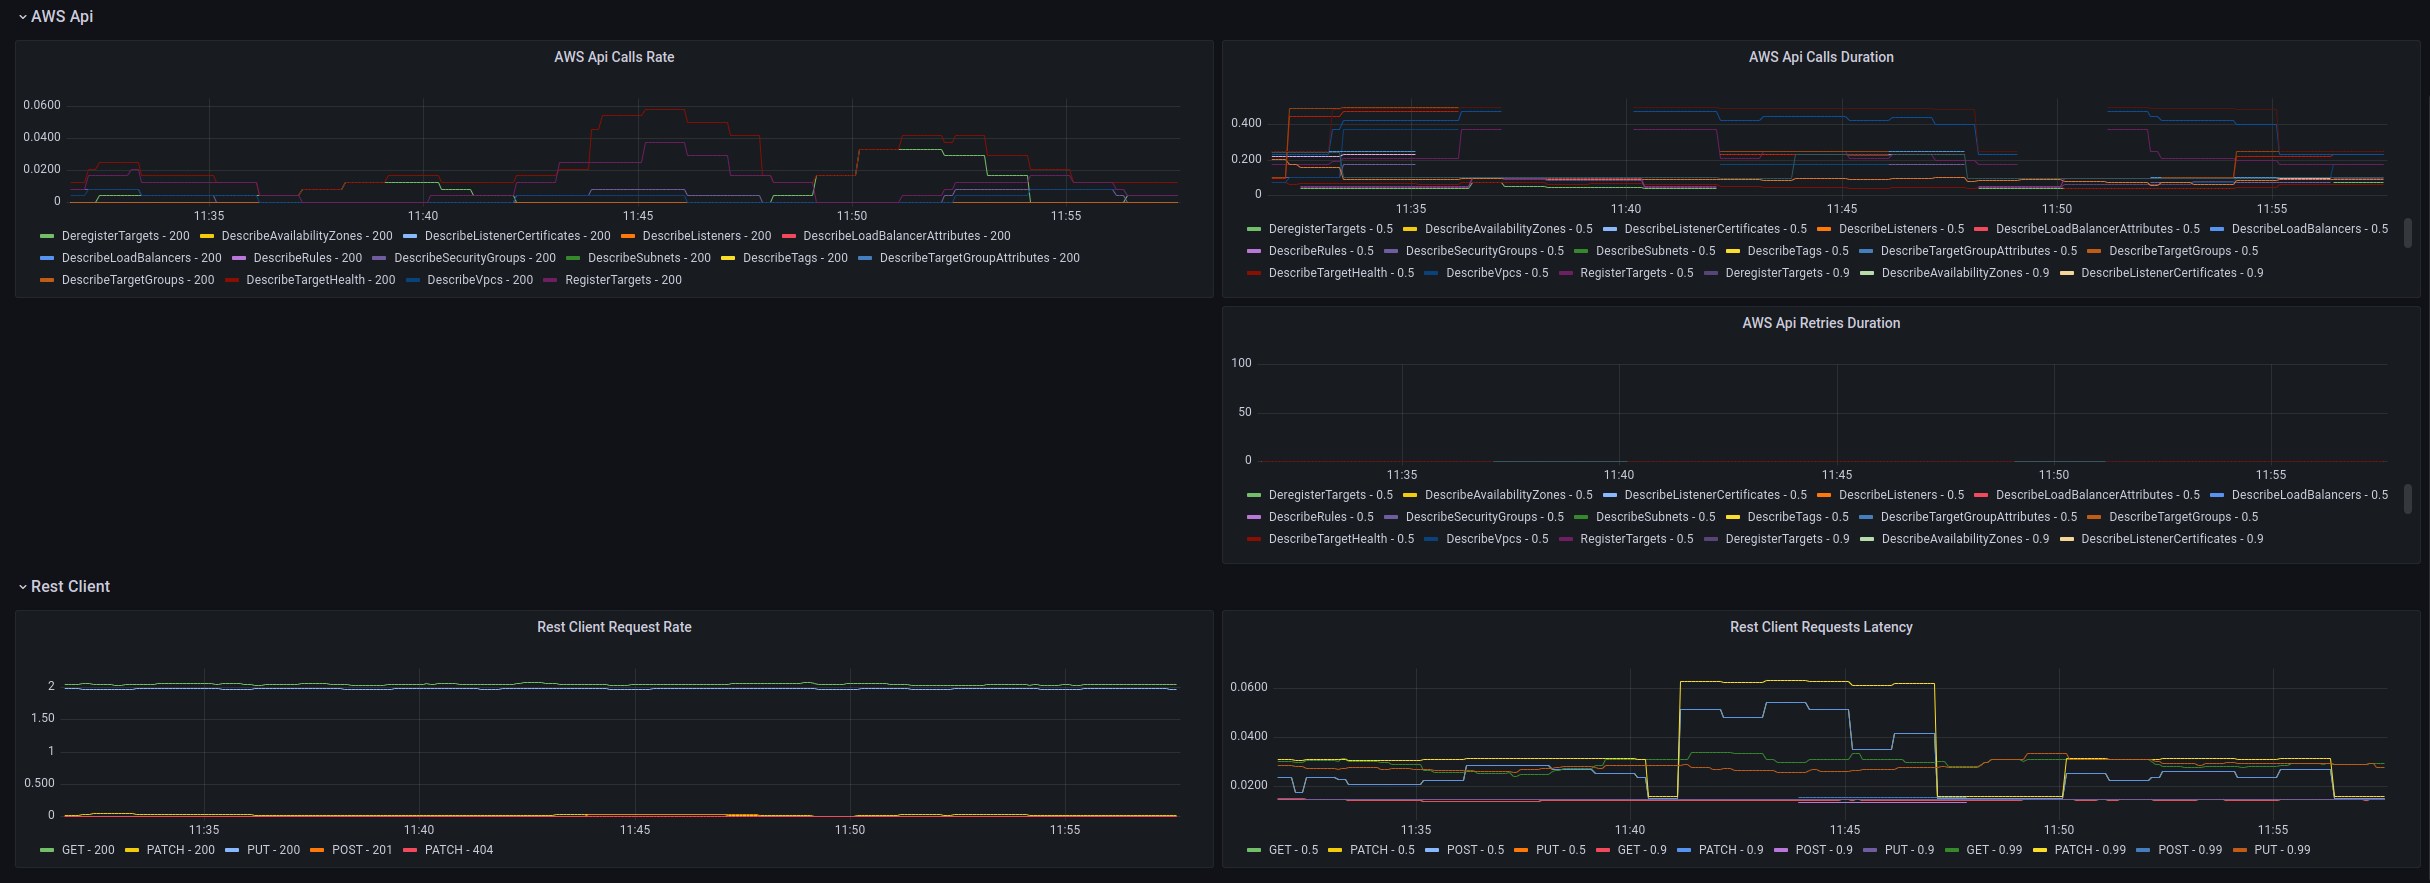
This dashboard monitors the health and performance of the AWS Load Balancer Controller, focusing on reconcile operations, API interactions, and REST client activity. It emphasizes reconciliation throughput and latency, with key metrics such as controller_runtime_reconcile_total, aws_api_calls_total, and aws_api_call_duration_seconds_bucket to surface success rates, error rates, and request latency, while also exposing operational load via controller max concurrent reconciles, active workers, and webhook requests. Overall, it provides a concise view of stability, throughput, and latency across the control plane and AWS API surface.
Screenshots
Used Metrics 1212
aws_api_call_duration_seconds_bucket
aws_api_call_retries_bucket
aws_api_calls_total
controller_runtime_active_workers
controller_runtime_max_concurrent_reconciles
controller_runtime_reconcile_errors_total
controller_runtime_reconcile_time_seconds_bucket
controller_runtime_reconcile_total
controller_runtime_webhook_requests_total
rest_client_request_latency_seconds_bucket
rest_client_requests_total
-
up