AWS CNI Metrics 10,217,80710,217,807 5.0 (1 reviews)
Description
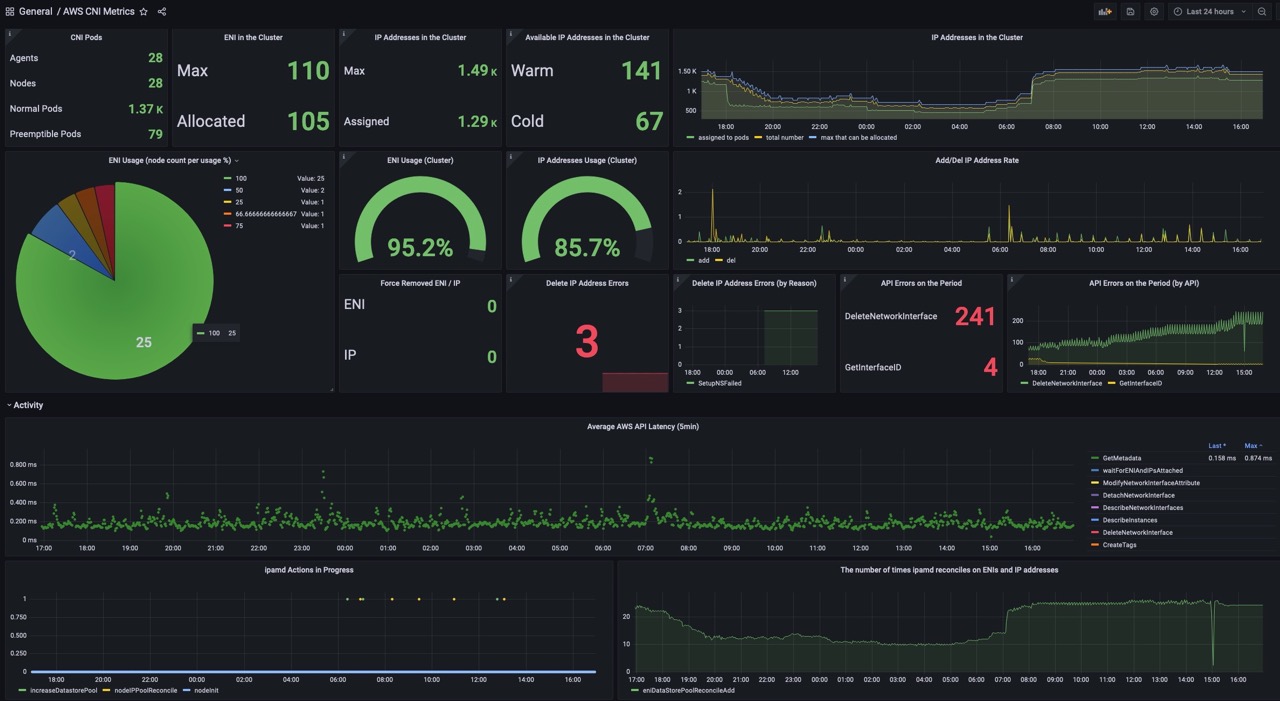
This dashboard monitors AWS VPC CNI (ipamd) activity and cluster IP/ENI utilization, combining node-level and cluster-wide metrics to track capacity, usage, and operational health. It highlights allocation and deletion dynamics, ENI/IP counts, and API interaction latency, with key panels like IP Addresses in the Cluster, ENI Usage (Cluster), and Add/Del IP Address Rate to surface provisioning pressure and potential bottlenecks. Metrics such as awscni_total_ip_addresses, awscni_assigned_ip_addresses, and awscni_add_ip_req_count are leveraged alongside latency and error signals to provide a concise view of current state and recent changes.
Screenshots
Used Metrics 1717
awscni_add_ip_req_count
awscni_assigned_ip_addresses
awscni_aws_api_error_count
awscni_aws_api_latency_ms_count
awscni_aws_api_latency_ms_sum
awscni_del_ip_req_count
awscni_eni_allocated
awscni_eni_max
awscni_force_removed_enis
awscni_force_removed_ips
awscni_ip_max
awscni_ipamd_action_inprogress
awscni_reconcile_count
awscni_total_ip_addresses
kube_node_labels
kube_pod_info
value