authentik 62,09662,096
Description
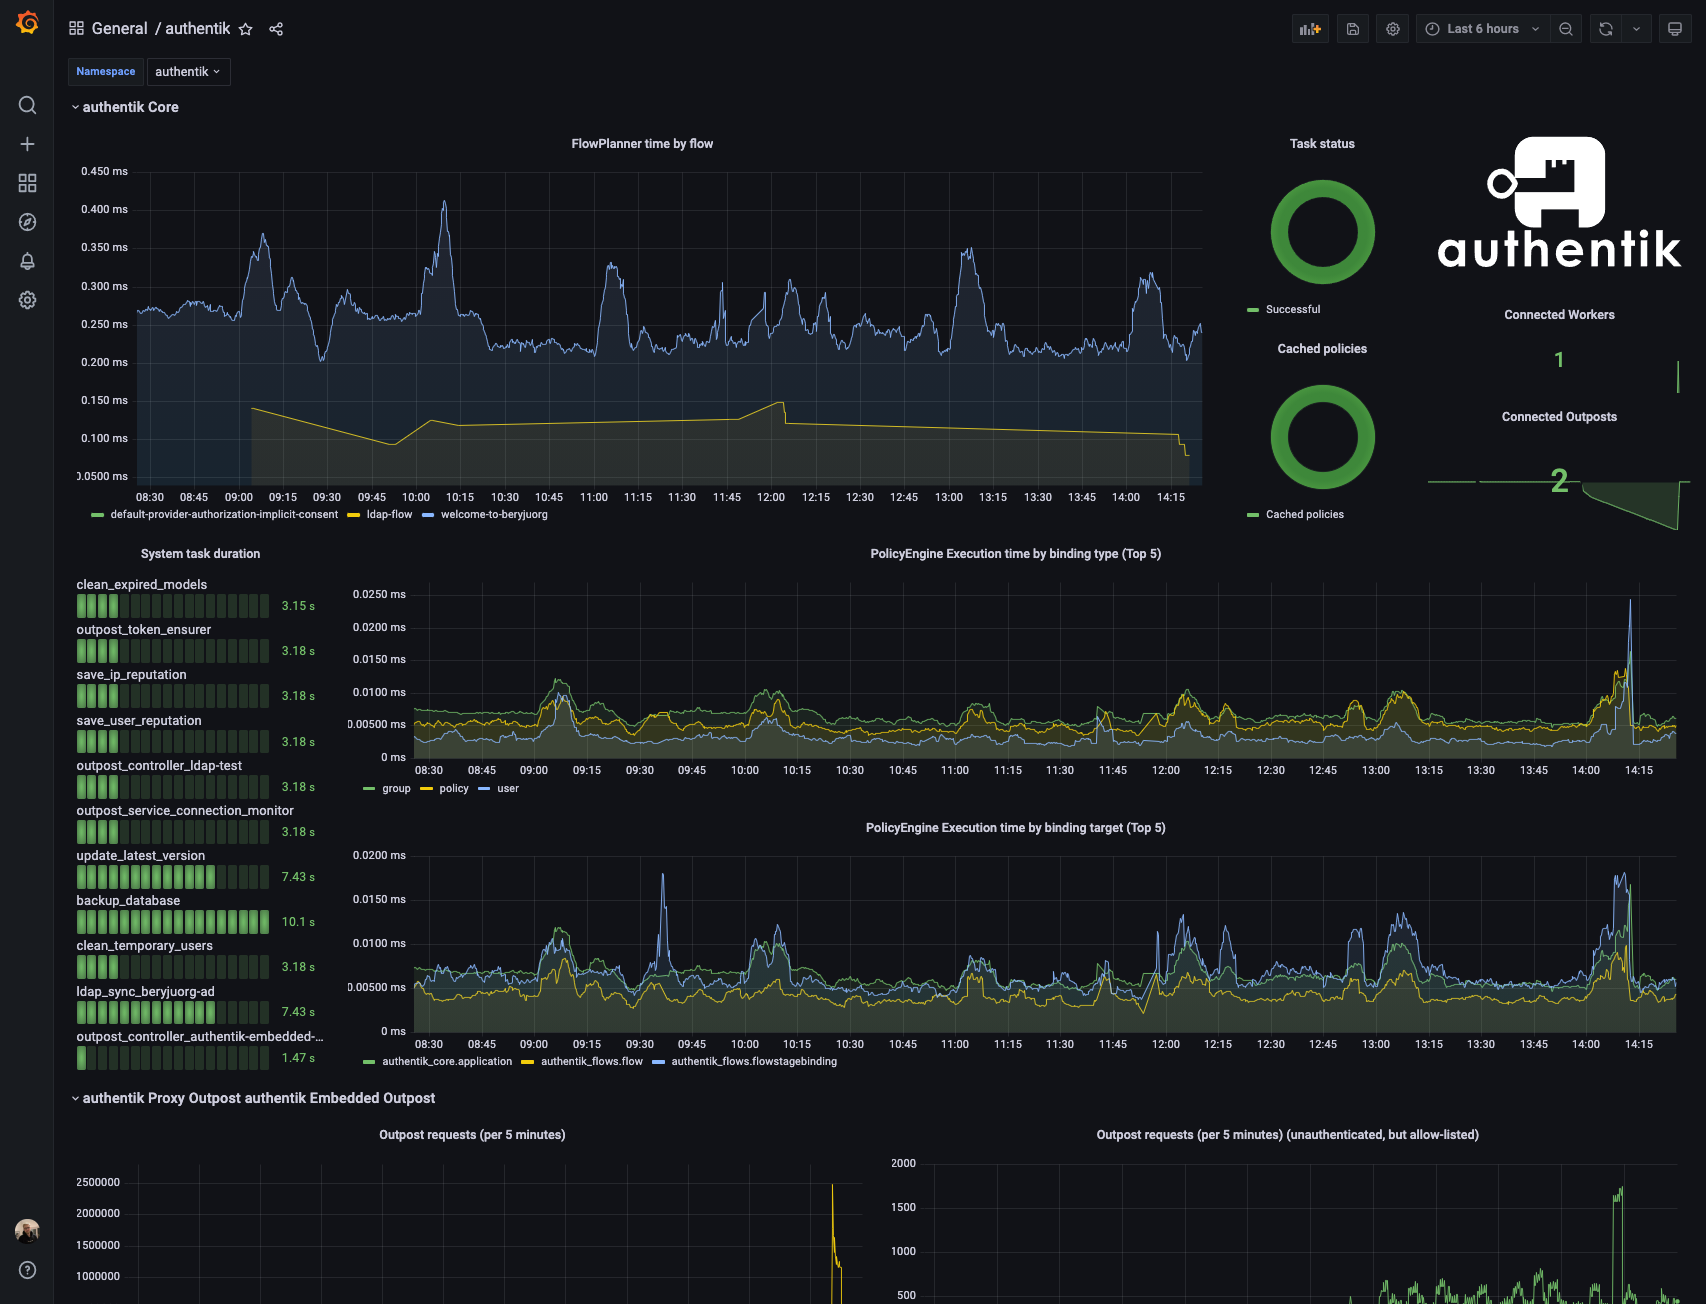
This dashboard provides end-to-end visibility into authentication flows and policy evaluation, including timing, status, and resource health. It highlights flow planning durations with authentik_flows_plan_time_sum/authentik_flows_plan_time_count, policy execution performance via authentik_policies_execution_time_sum/authentik_policies_execution_time_count, and system workload with metrics like authentik_system_tasks and authentik_admin_workers to monitor throughput and bottlenecks. Other panels surface operational metrics such as outpost connectivity, LDAP request patterns, and cached policies, enabling quick detection of anomalies and capacity issues.
Screenshots
Used Metrics 1717
authentik_admin_workers
authentik_flows_plan_time_count
authentik_flows_plan_time_sum
authentik_models
authentik_outpost_flow_timing_get_bucket
authentik_outpost_flow_timing_post_bucket
authentik_outpost_ldap_requests_bucket
authentik_outpost_ldap_requests_rejected
authentik_outpost_ldap_requests_sum
authentik_outpost_proxy_requests_sum
authentik_outposts_connected
authentik_policies_cached
authentik_policies_execution_time_count
authentik_policies_execution_time_sum
authentik_system_tasks
group
topk