ASP.NET OTEL Metrics from OTEL Collector 963963
Description
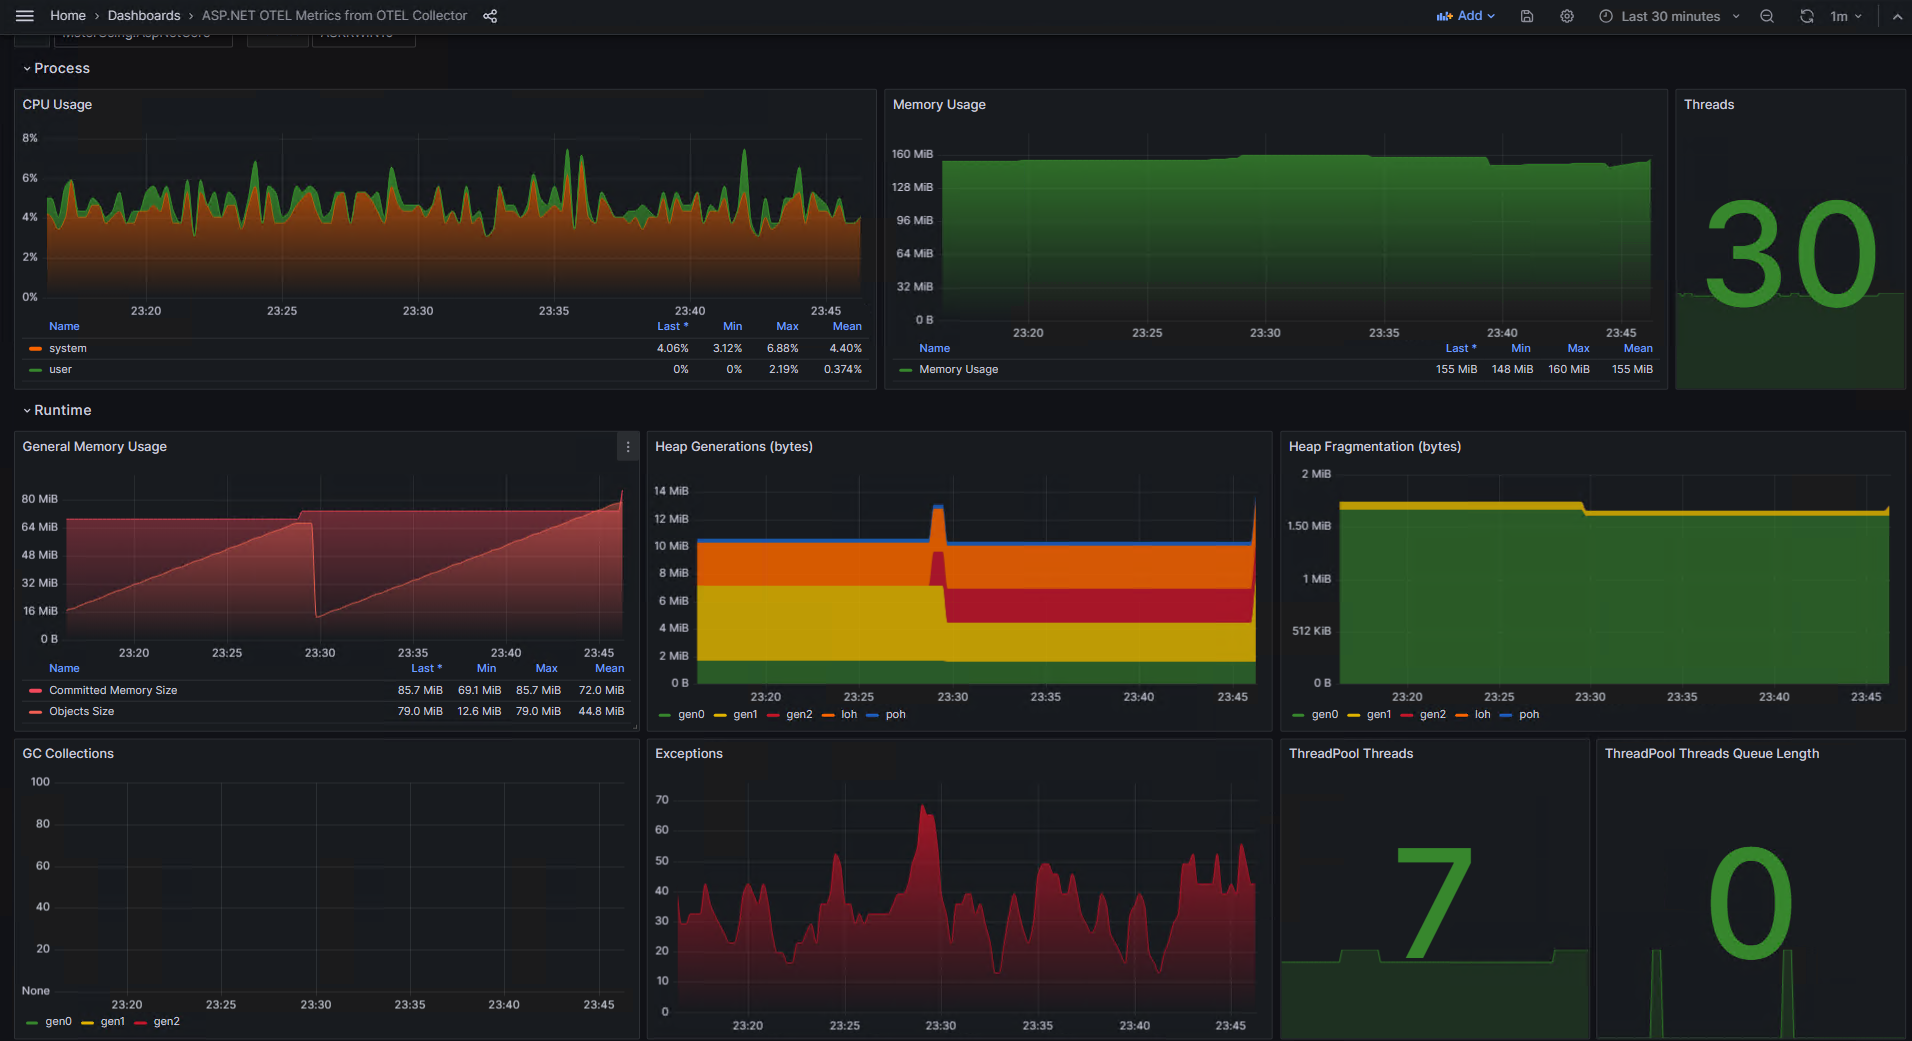
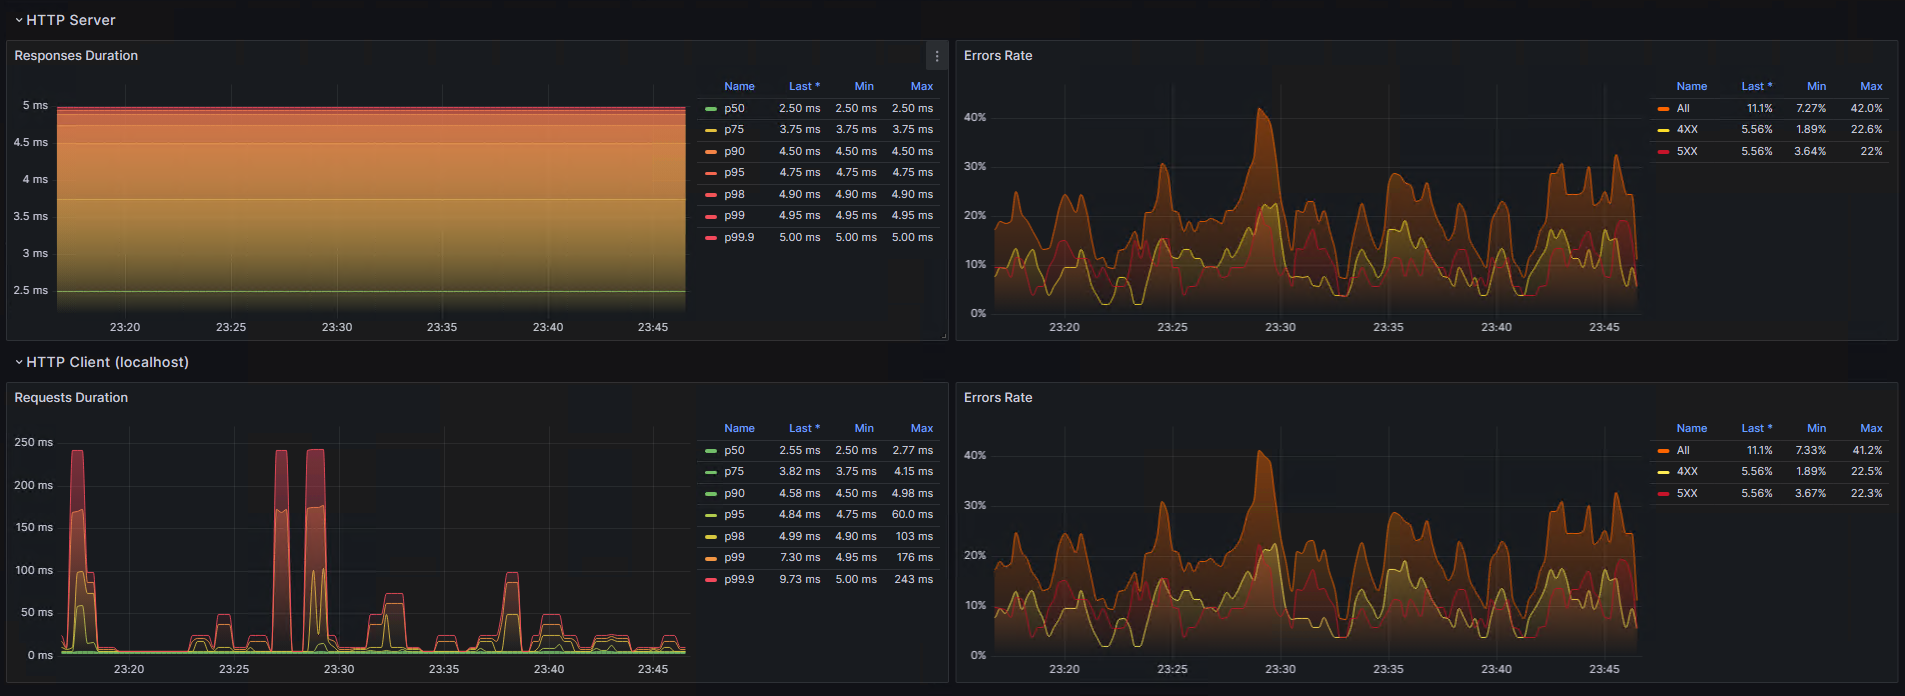
Shows .NET and ASP.NET metrics pushed to OTEL Collector and scraped by Prometheus from OTEL Collector
Screenshots
Used Metrics 1616
http_client_request_duration_seconds_bucket
http_server_duration_milliseconds_bucket
http_server_request_duration_seconds_bucket
http_server_request_duration_seconds_count
process_cpu_time_seconds_total
process_memory_usage_bytes
process_runtime_dotnet_exceptions_count_total
process_runtime_dotnet_gc_allocations_size_bytes_total
process_runtime_dotnet_gc_collections_count_total
process_runtime_dotnet_gc_committed_memory_size_bytes
process_runtime_dotnet_gc_heap_fragmentation_size_bytes
process_runtime_dotnet_gc_heap_size_bytes
process_runtime_dotnet_gc_objects_size_bytes
process_runtime_dotnet_thread_pool_queue_length
process_runtime_dotnet_thread_pool_threads_count
process_threads