ASP.NET OTEL Metrics 19,75519,755
12/26/2022
11/30/2023
3
Web Servers
>=10.1.4
Prometheus
Description
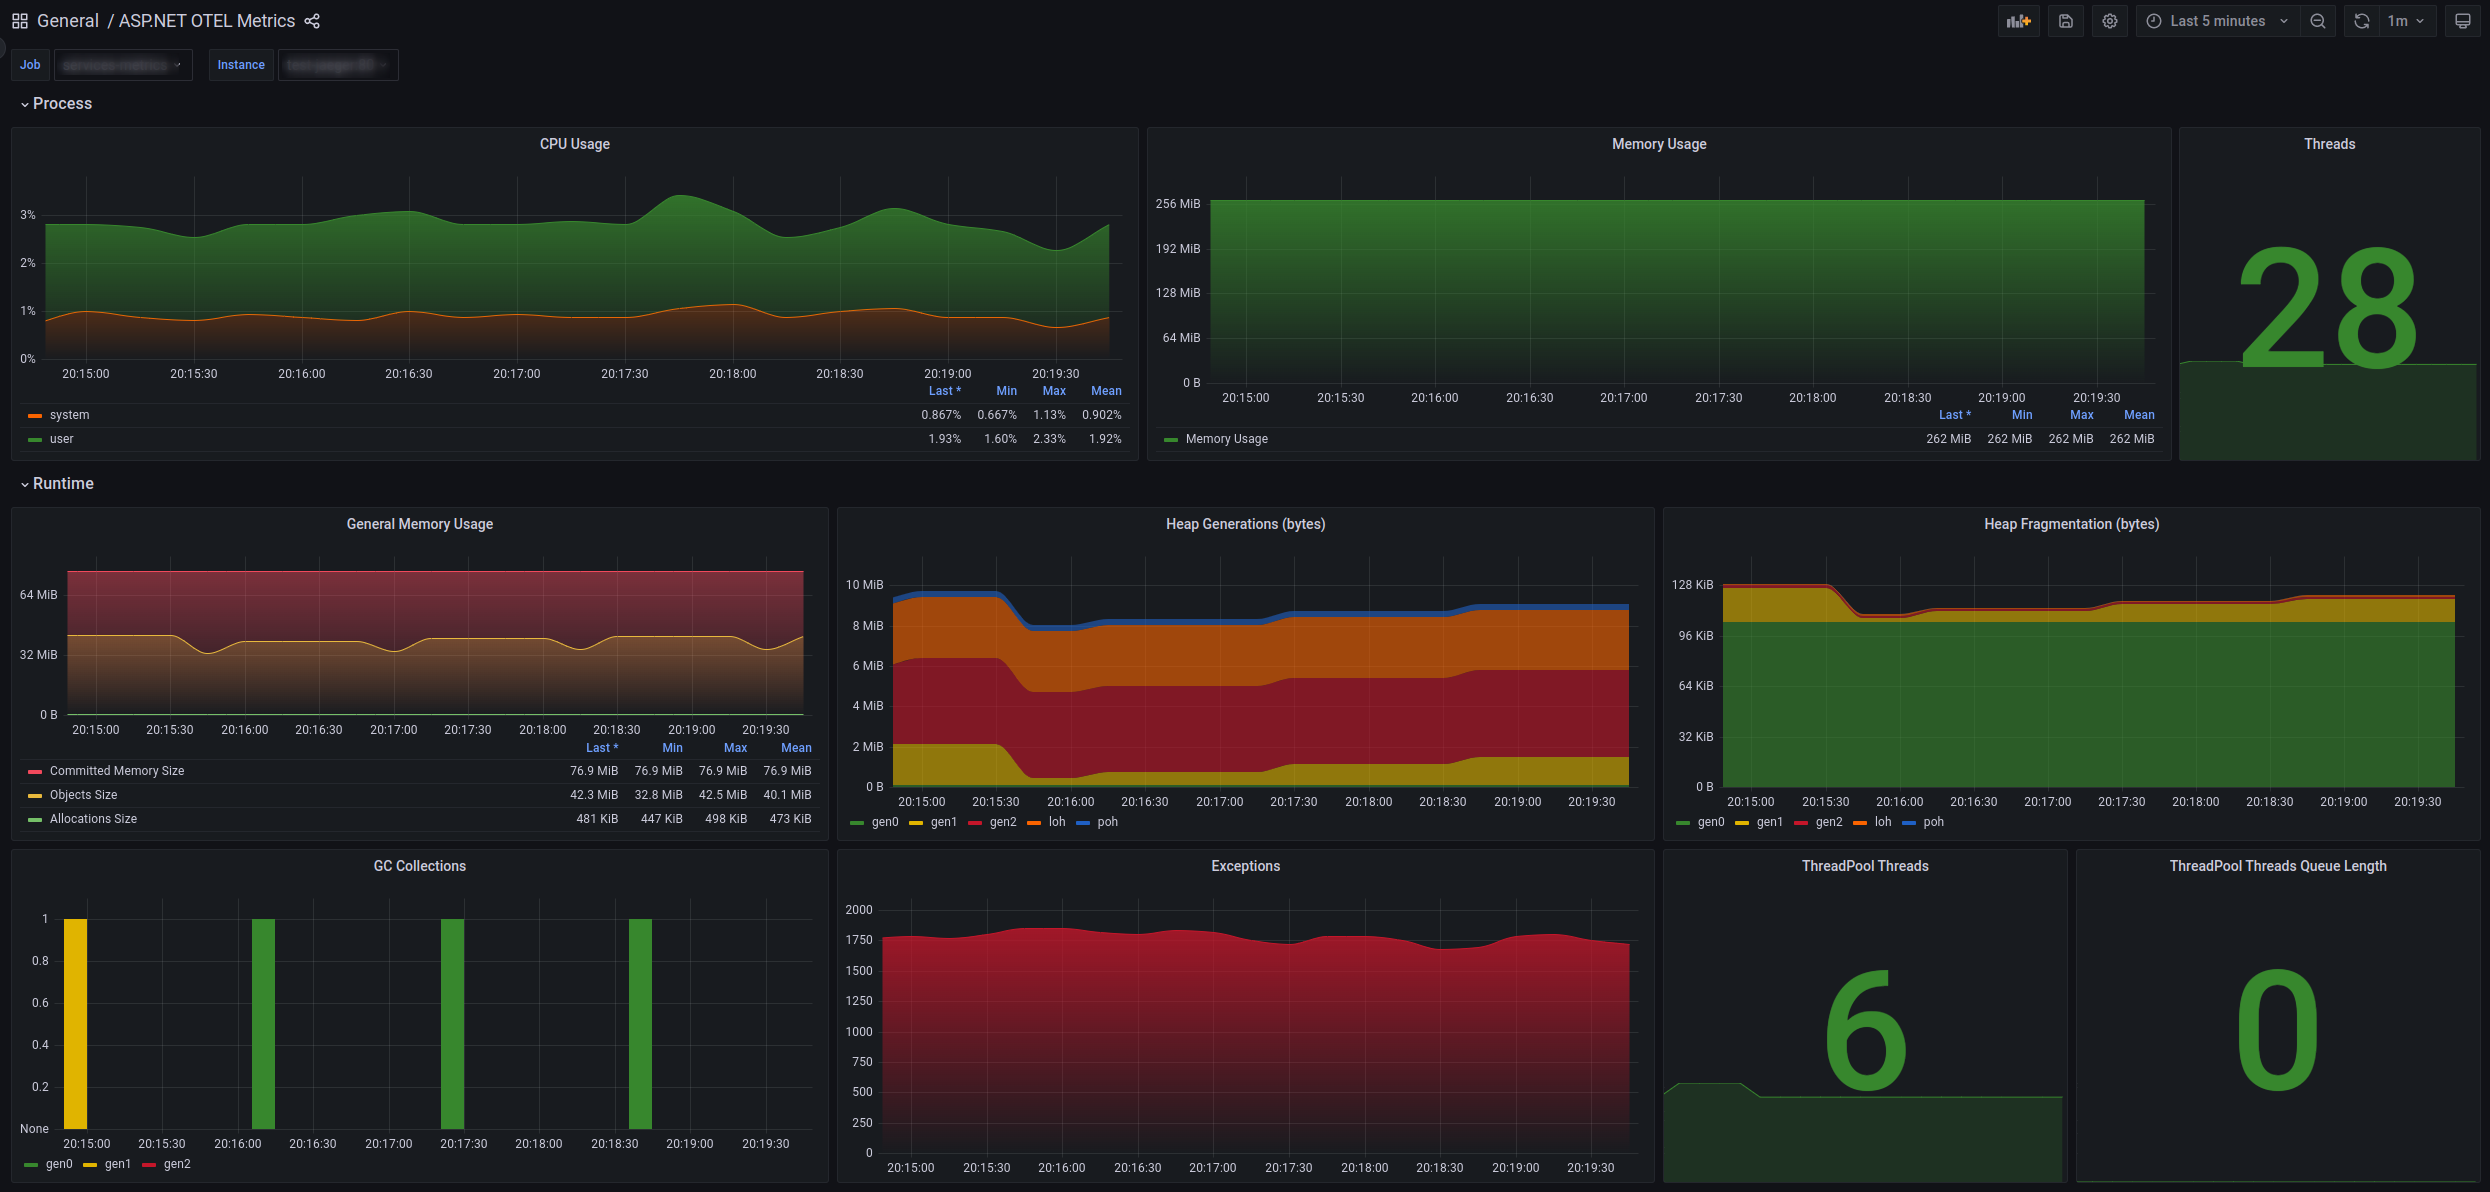
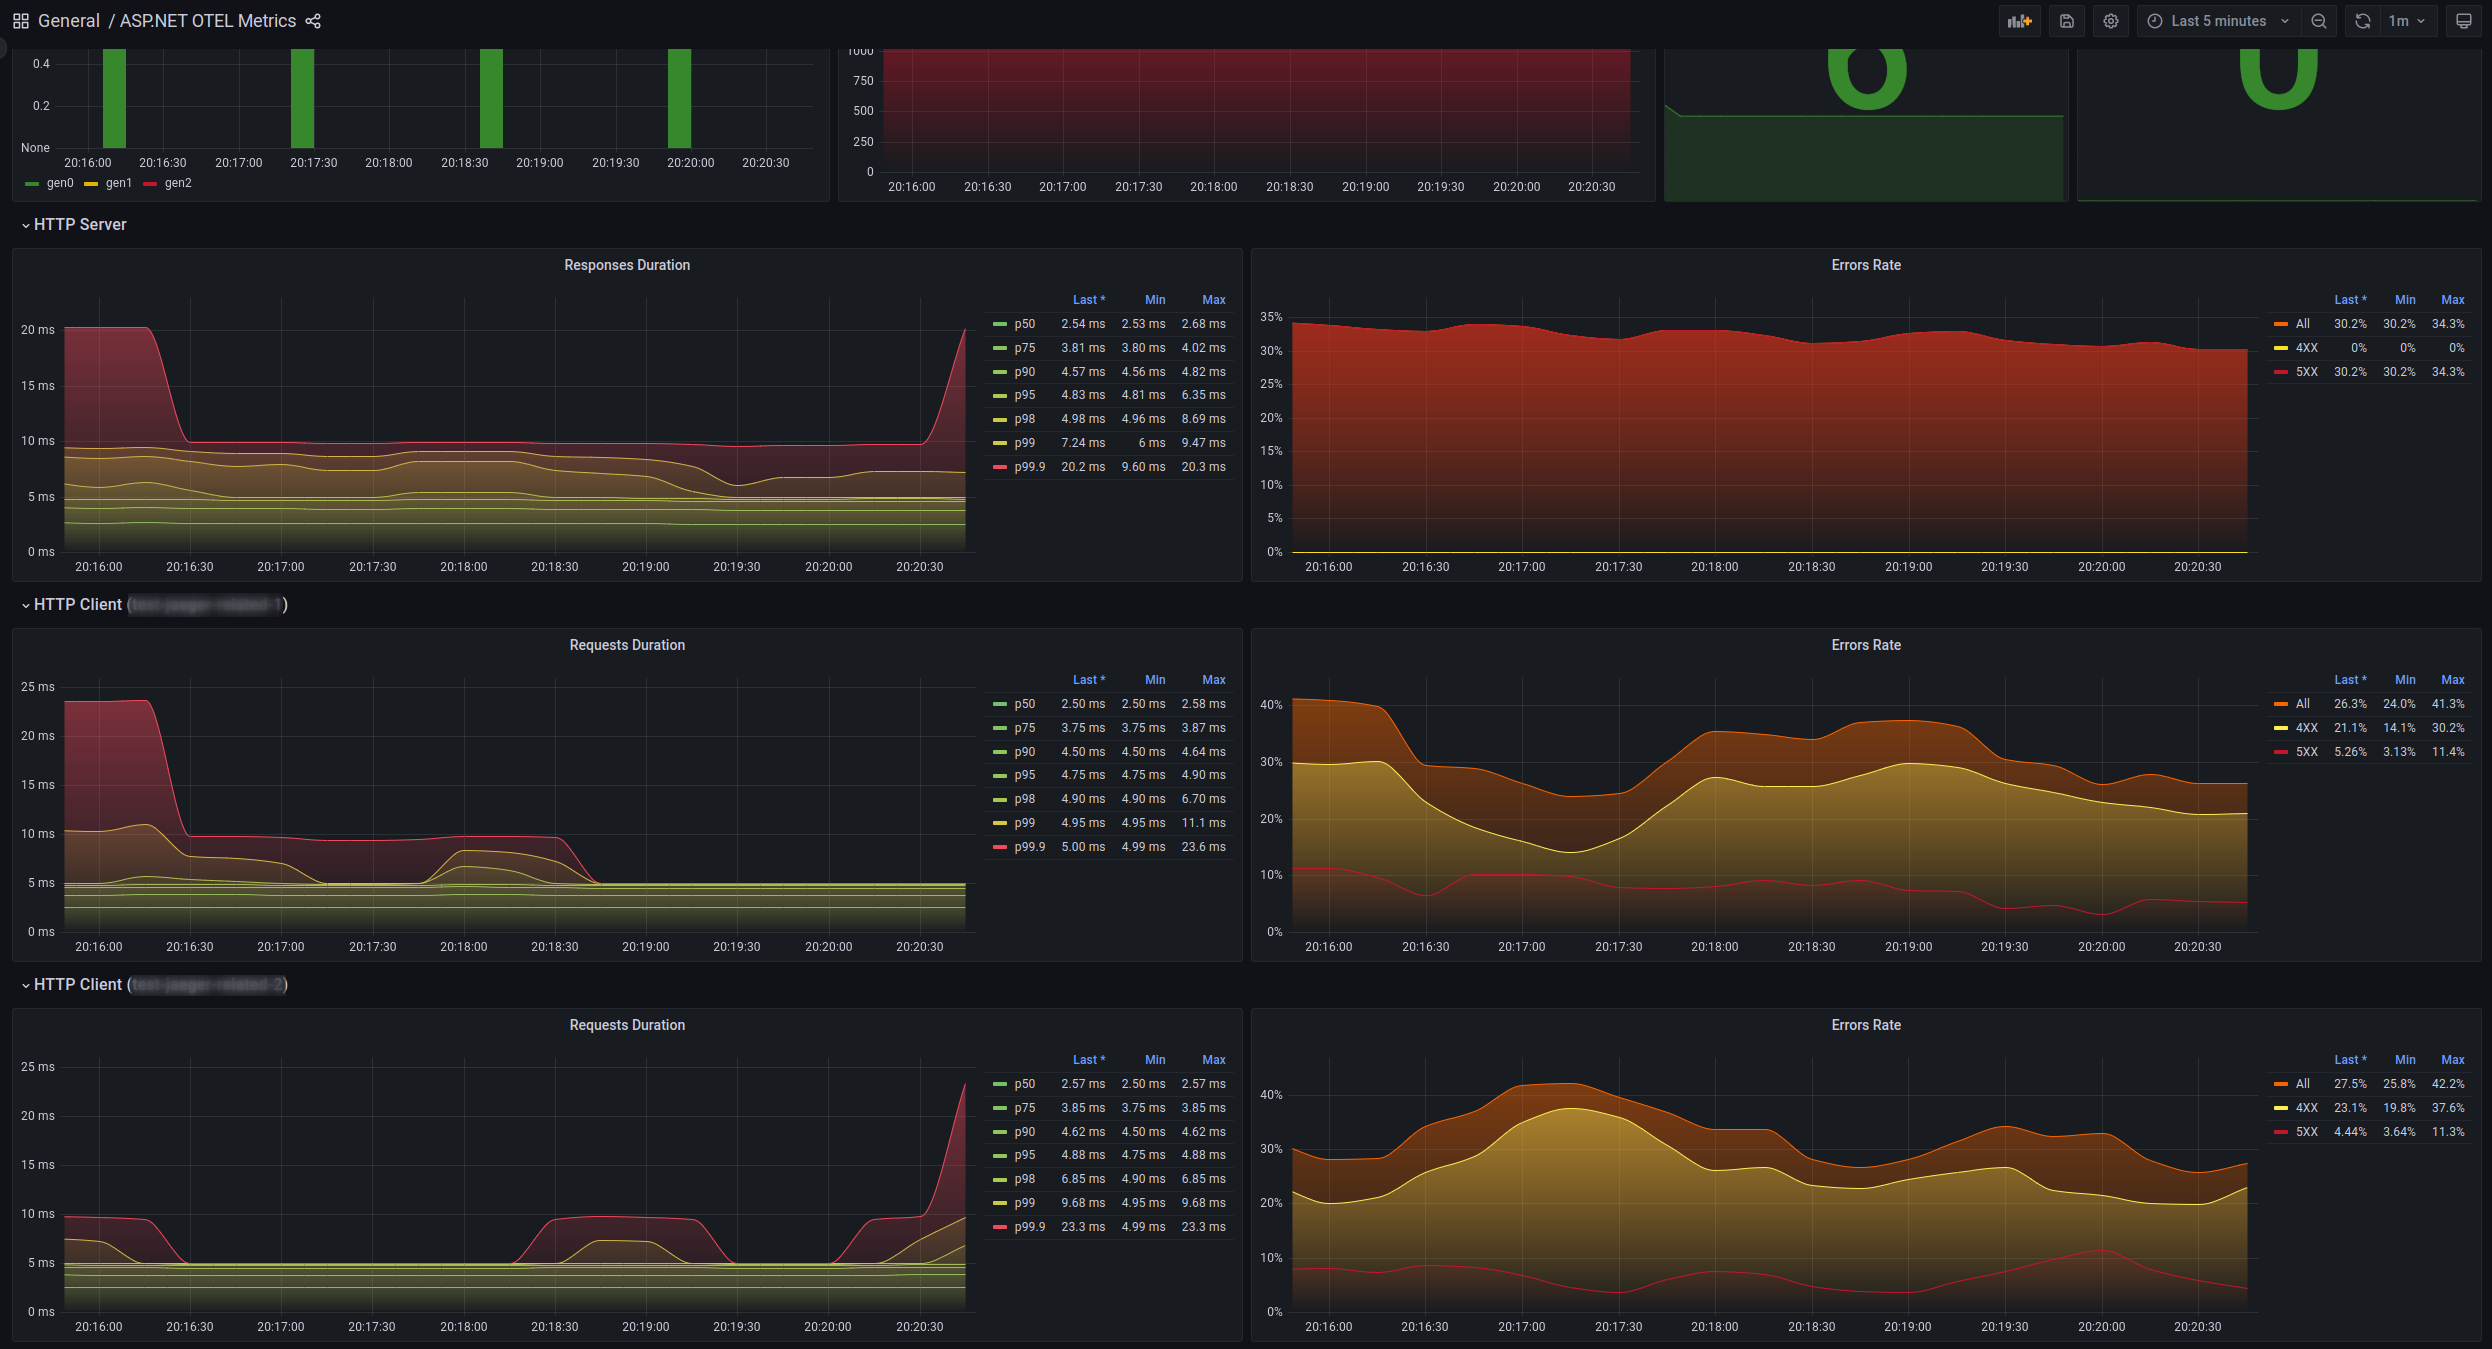
Shows ASP.NET metrics from OpenTelemetry NuGet
Screenshots
Used Metrics 1515
http_client_duration_milliseconds_bucket
http_server_duration_milliseconds_bucket
http_server_duration_milliseconds_count
process_cpu_time_seconds_total
process_memory_usage_bytes
process_runtime_dotnet_exceptions_count_total
process_runtime_dotnet_gc_allocations_size_bytes_total
process_runtime_dotnet_gc_collections_count_total
process_runtime_dotnet_gc_committed_memory_size_bytes
process_runtime_dotnet_gc_heap_fragmentation_size_bytes
process_runtime_dotnet_gc_heap_size_bytes
process_runtime_dotnet_gc_objects_size_bytes
process_runtime_dotnet_thread_pool_queue_length
process_runtime_dotnet_thread_pool_threads_count
process_threads
Get Dashboard✕
Download
Copy to Clipboard