ASP.NET Core Endpoint 12,22512,225
11/8/2023
4/7/2025
4
Prometheus
Description
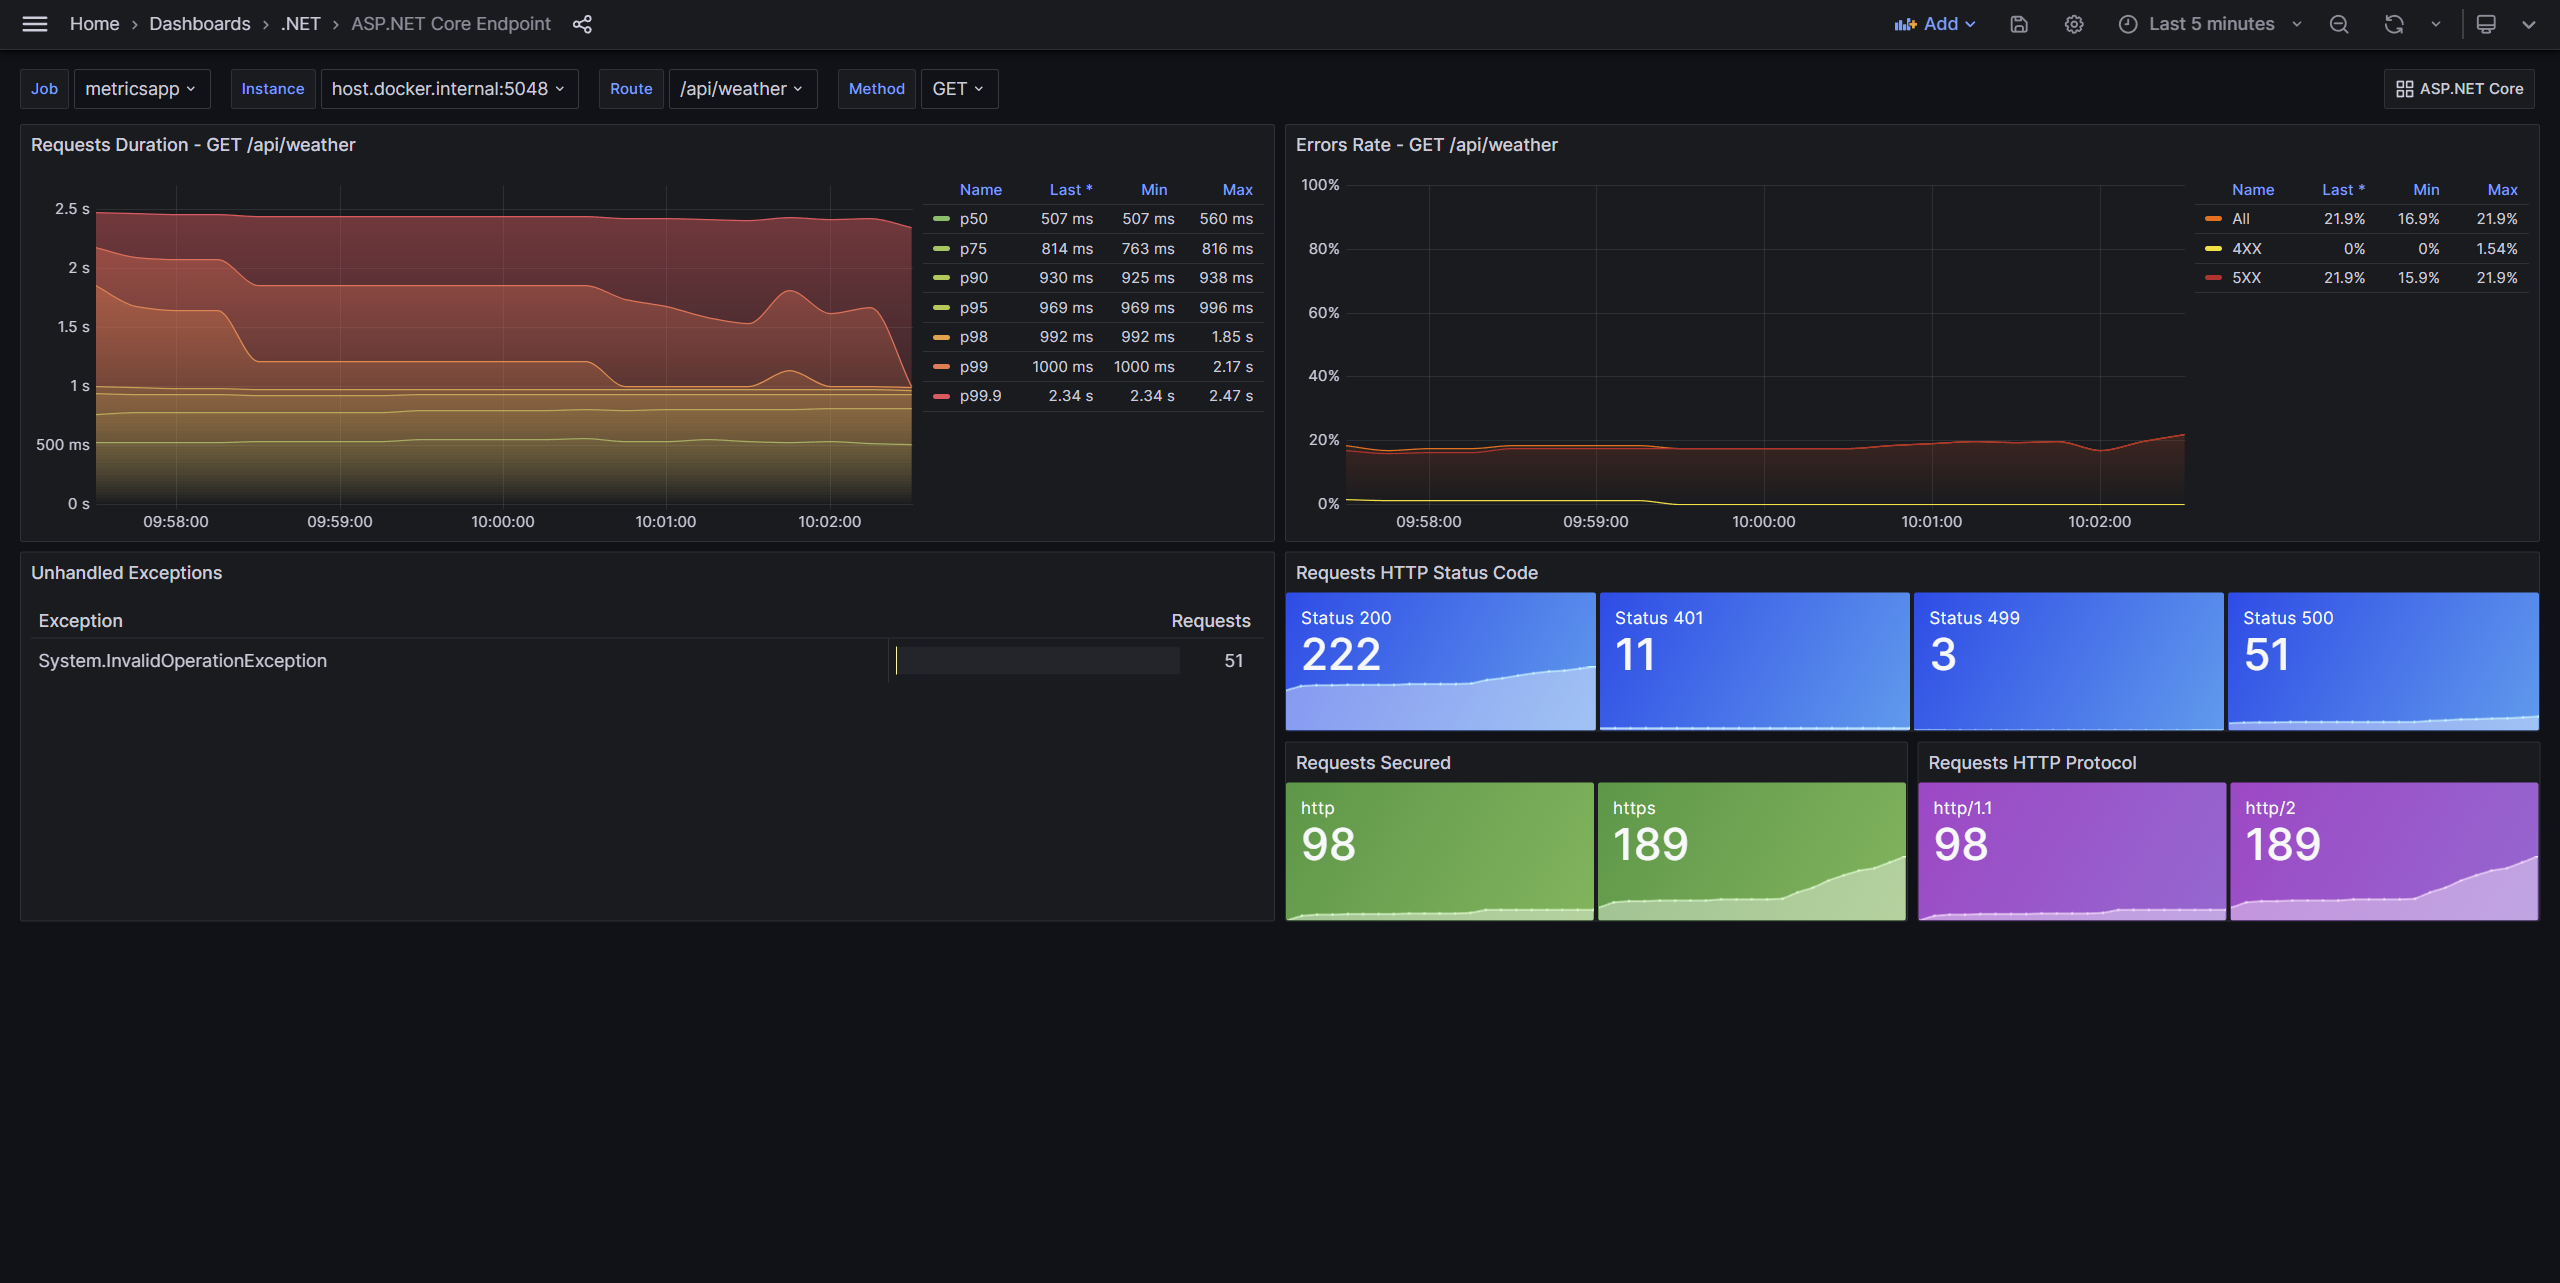
ASP.NET Core endpoint metrics from OpenTelemetry
Screenshots
Used Metrics 55
http
http_server_request_duration_seconds_bucket
http_server_request_duration_seconds_count
method_route
network_protocol_version
Get Dashboard✕
Download
Copy to Clipboard