ASP.NET Core - controller summary (Prometheus) 392,523392,523
9/26/2019
9/27/2019
4
Web Servers
>=6.3.6
Prometheus
Description
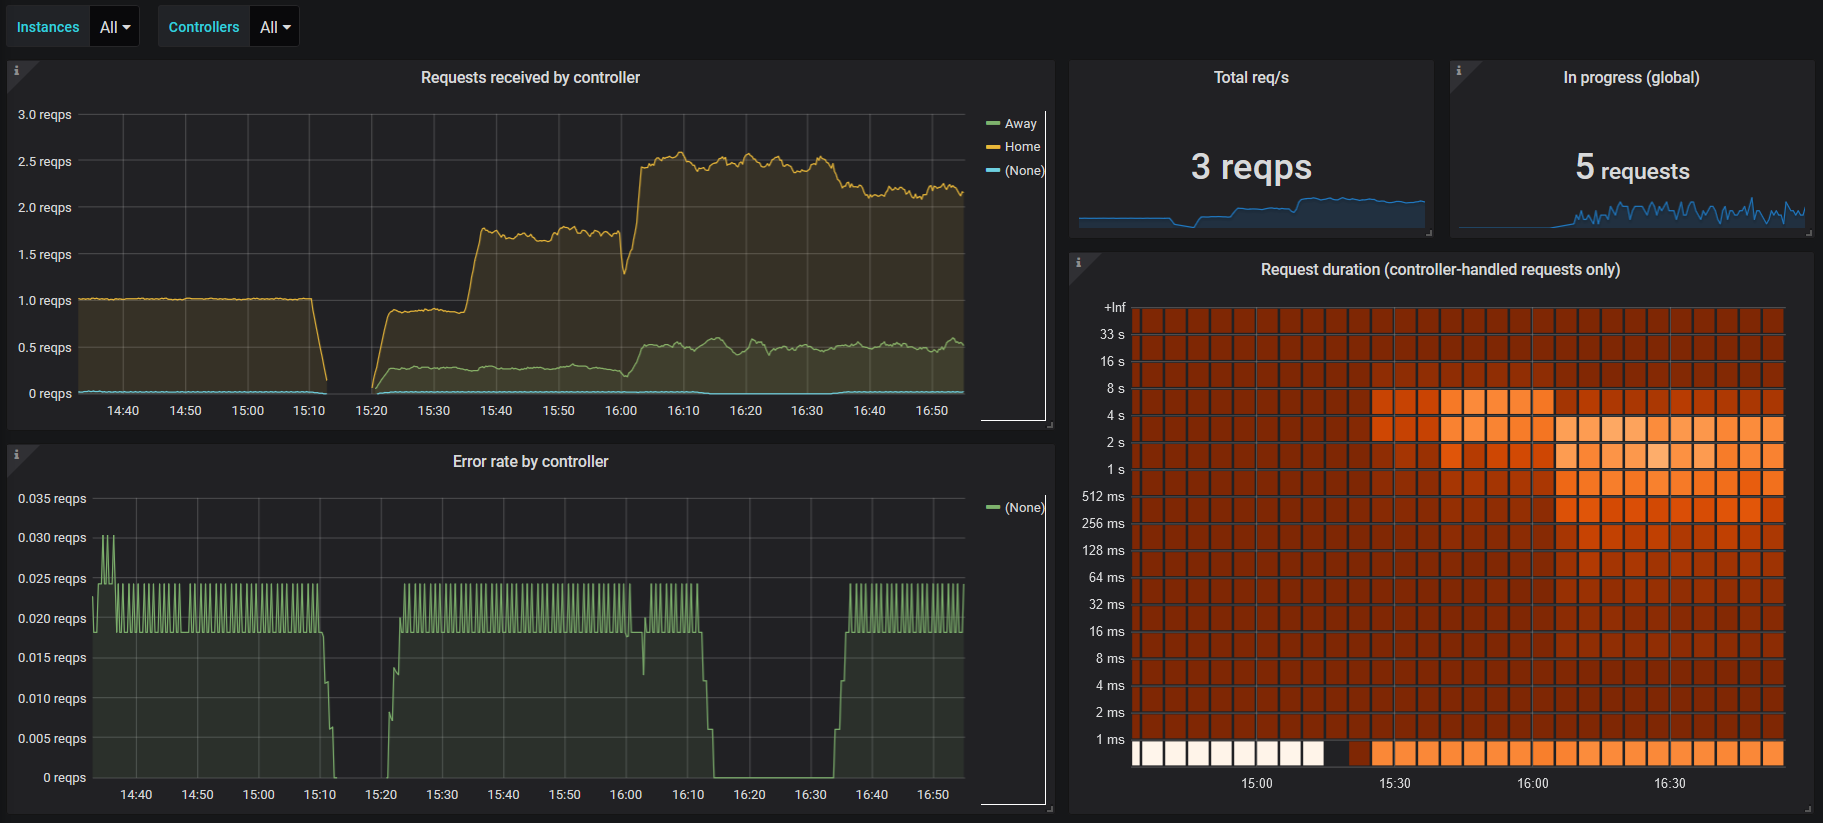
This dashboard monitors ASP.NET Core controller activity by aggregating request metrics from Prometheus. It highlights throughput and latency with http_requests_received_total, http_request_duration_seconds_bucket, and http_requests_in_progress to show requests per second, distribution of response times, and current in-flight requests, with panels like "Requests received by controller" and "Request duration (controller-handled requests only)" providing actionable insight into performance and reliability.
Screenshots
Used Metrics 33
http_request_duration_seconds_bucket
http_requests_in_progress
http_requests_received_total
Get Dashboard✕
Download
Copy to Clipboard