ASP.NET Core 14,56714,567
11/8/2023
4/7/2025
5
AWSAzureWeb Servers
Prometheus
Description
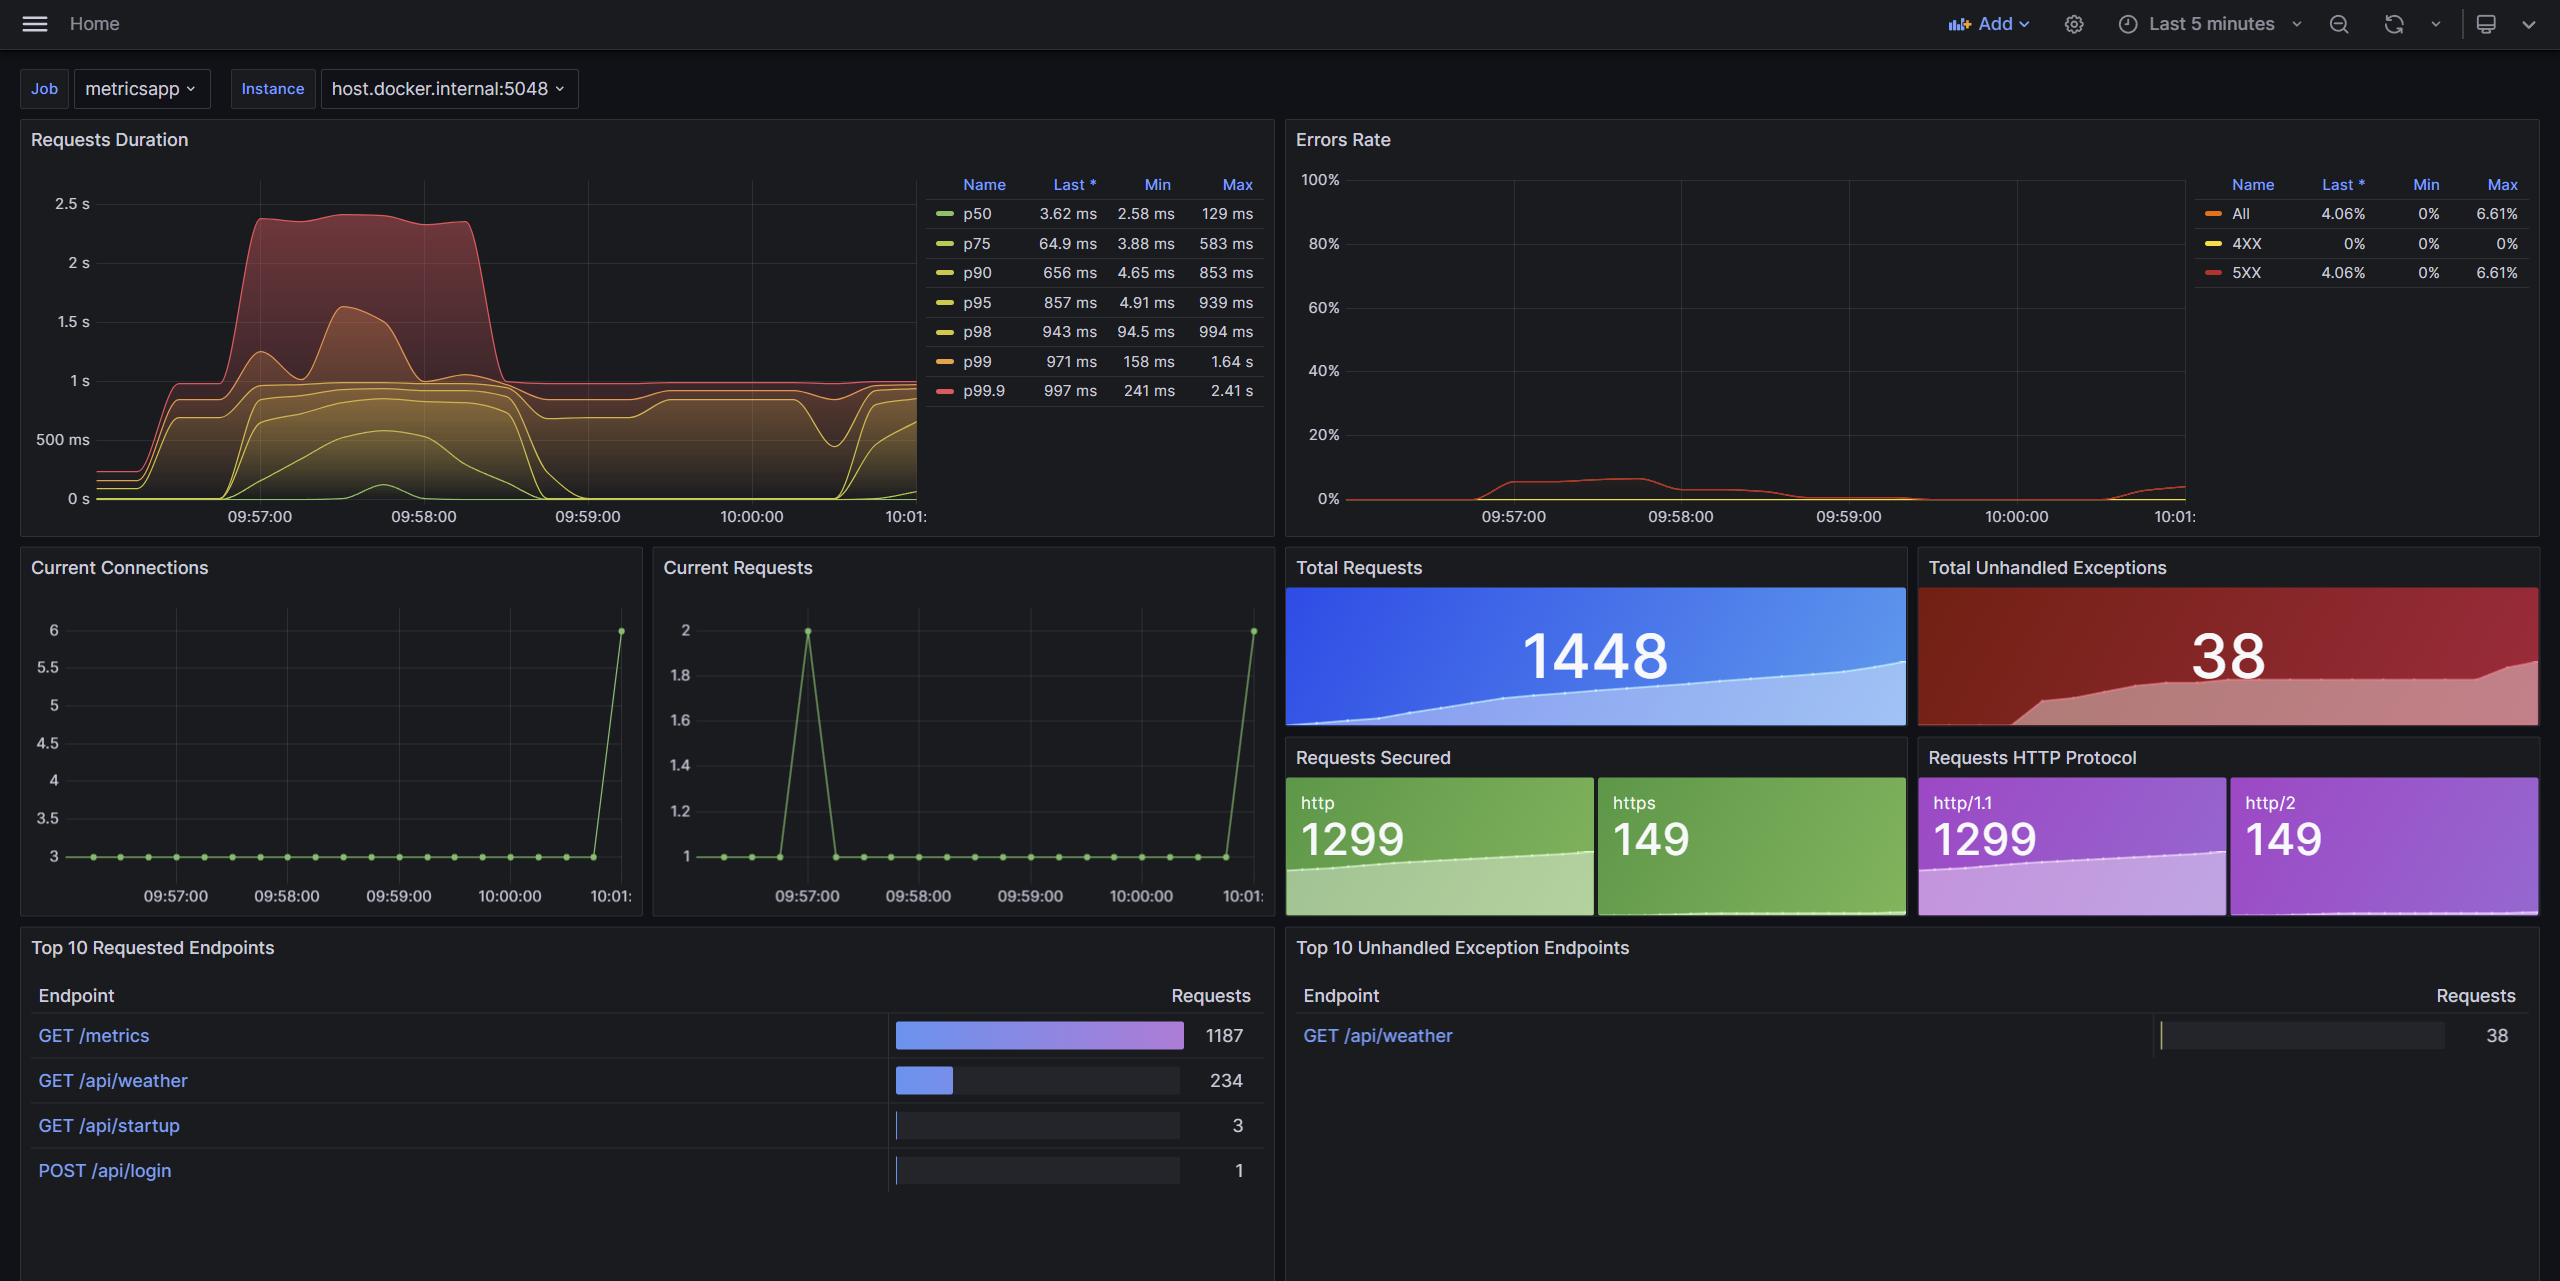
ASP.NET Core metrics from OpenTelemetry
Screenshots
Used Metrics 1010
http
http_request_method
http_route
http_server_active_requests
http_server_request_duration_seconds_bucket
http_server_request_duration_seconds_count
kestrel_active_connections
method_route
network_protocol_version
topk
Get Dashboard✕
Download
Copy to Clipboard