ascend-npu-exporter 904904
2/29/2024
8/25/2025
3
Host Metrics
>=9.3.2
Prometheus
Description
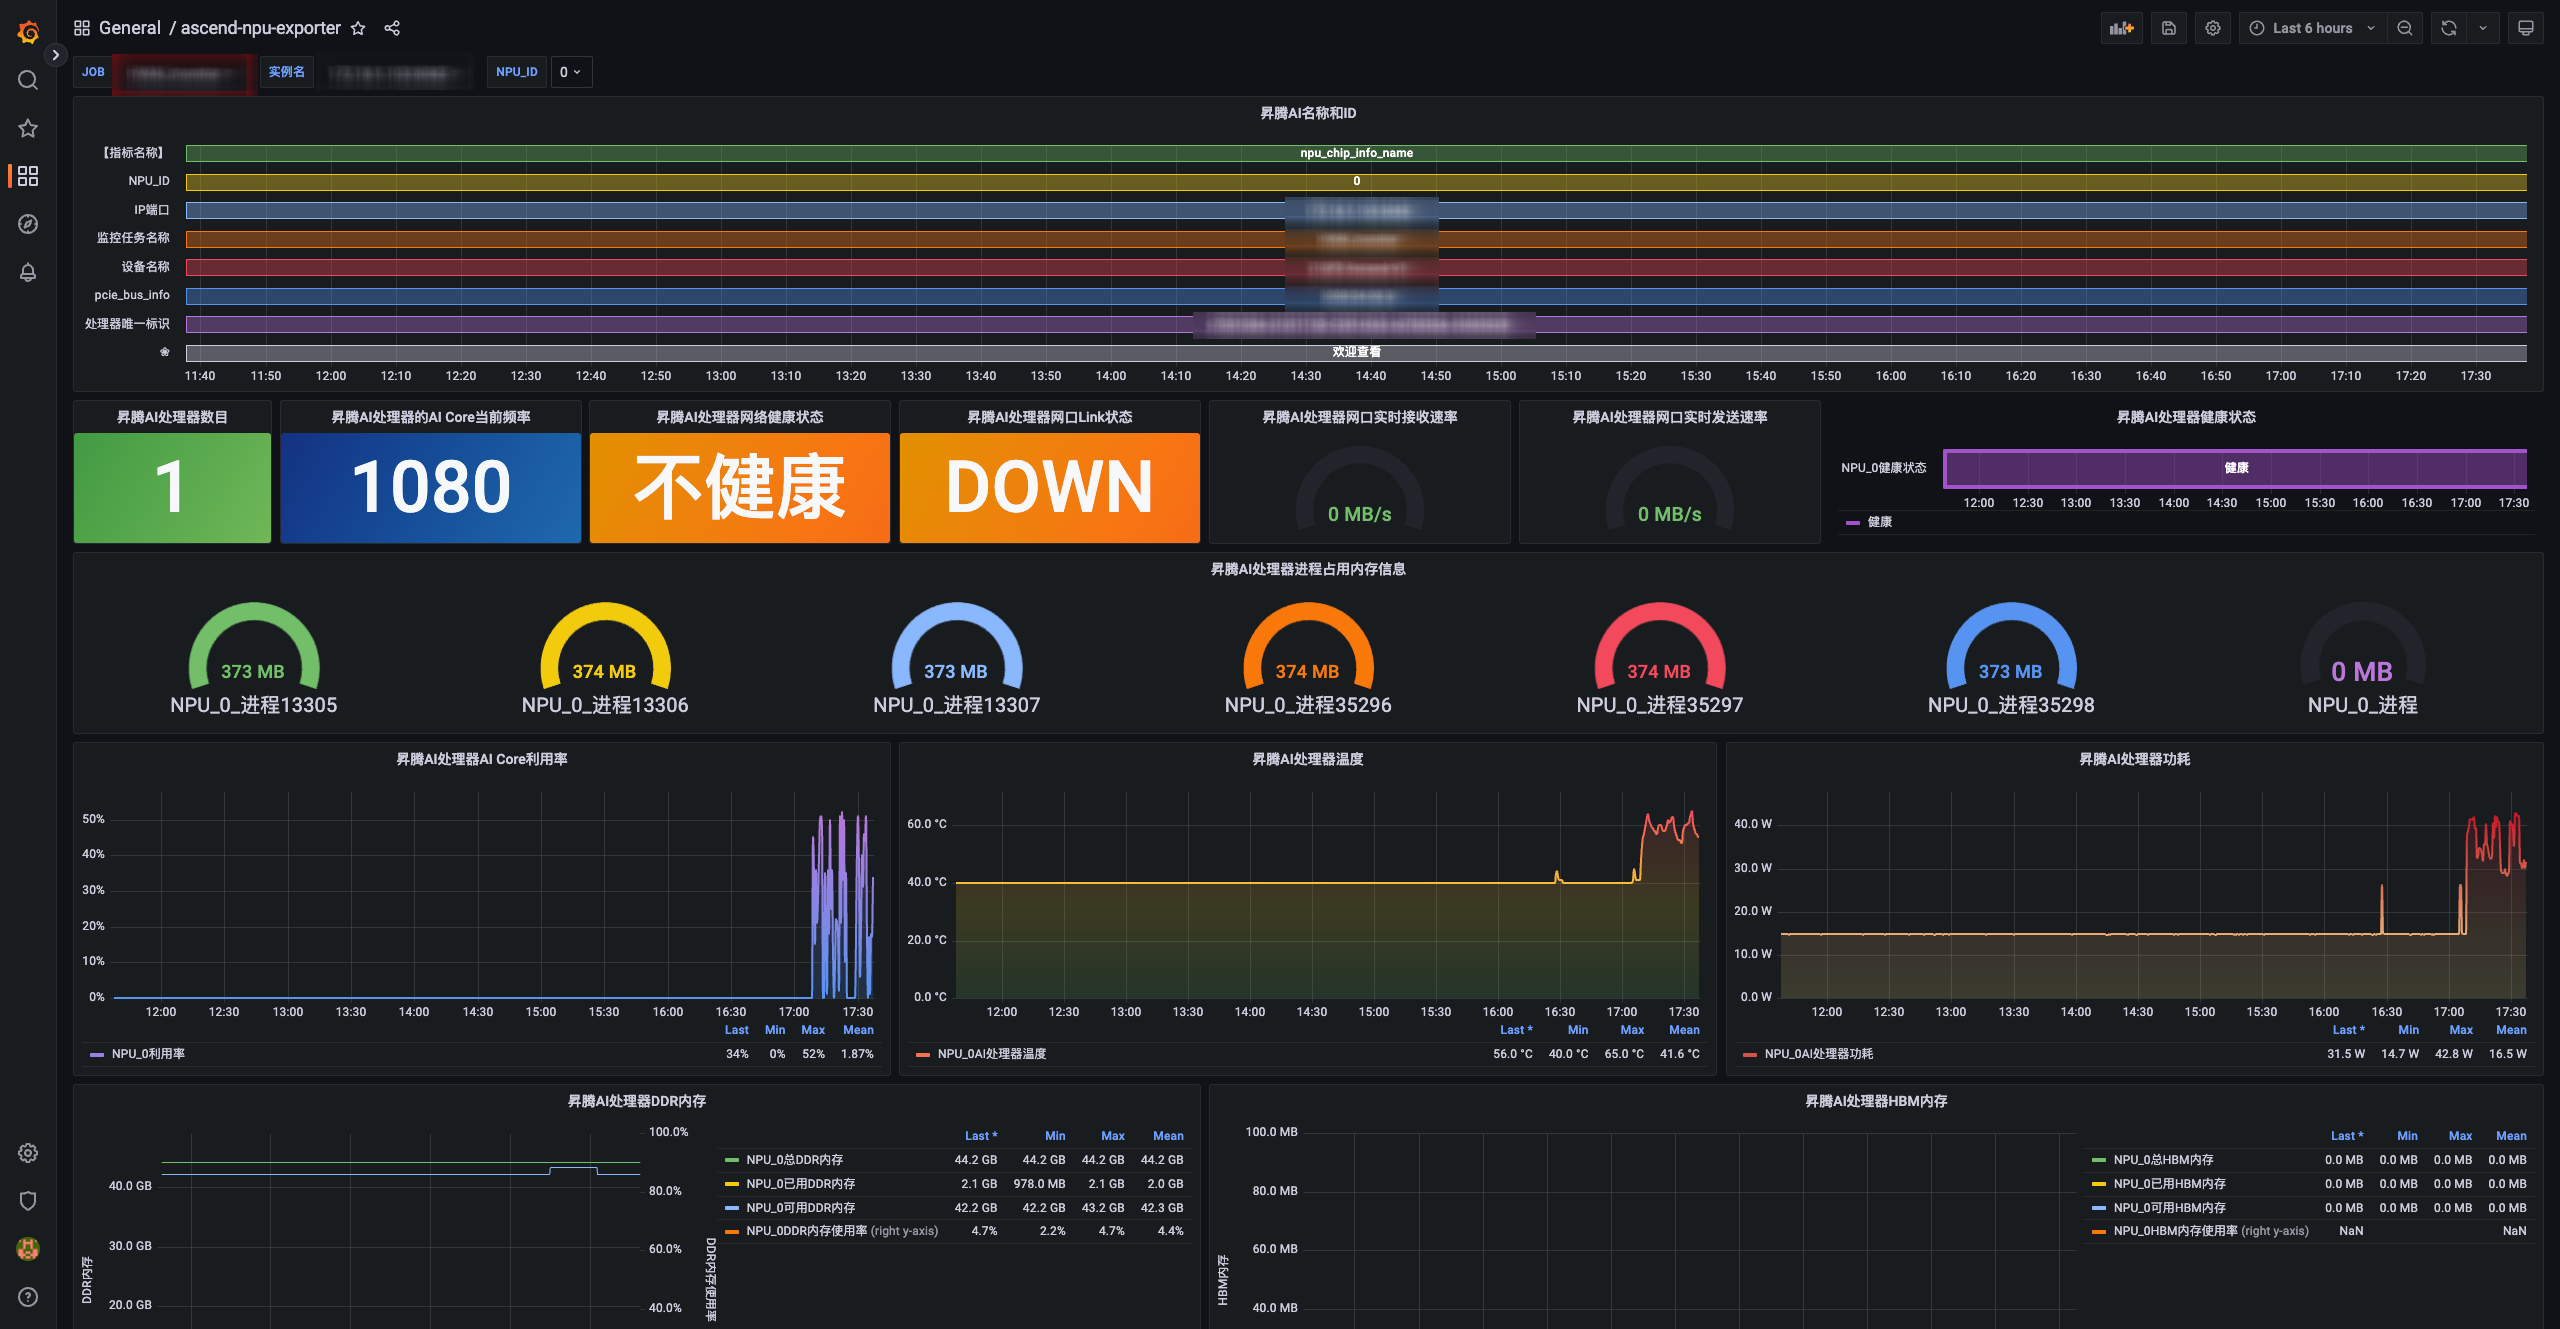
「Ascend Npu Monitor」 A Grafana dashboard for monitoring Ascend NPU metrics via ascend-npu-exporter. Visualize AI Core utilization, temperature, power, memory, and network status in real time. 基于 ascend-npu-exporter 的昇腾NPU监控面板,支持AI Core、温度、功耗、内存、网络等关键指标的实时可视化。
Screenshots
Used Metrics 1616
machine_npu_nums
npu_chip_info_aicore_current_freq
npu_chip_info_bandwidth_rx
npu_chip_info_bandwidth_tx
npu_chip_info_hbm_total_memory
npu_chip_info_hbm_used_memory
npu_chip_info_health_status
npu_chip_info_link_status
npu_chip_info_name
npu_chip_info_network_status
npu_chip_info_power
npu_chip_info_process_info
npu_chip_info_temperature
npu_chip_info_total_memory
npu_chip_info_used_memory
npu_chip_info_utilization
Get Dashboard✕
Download
Copy to Clipboard