ArgoWorkflow Metrics 559,388559,388
Description
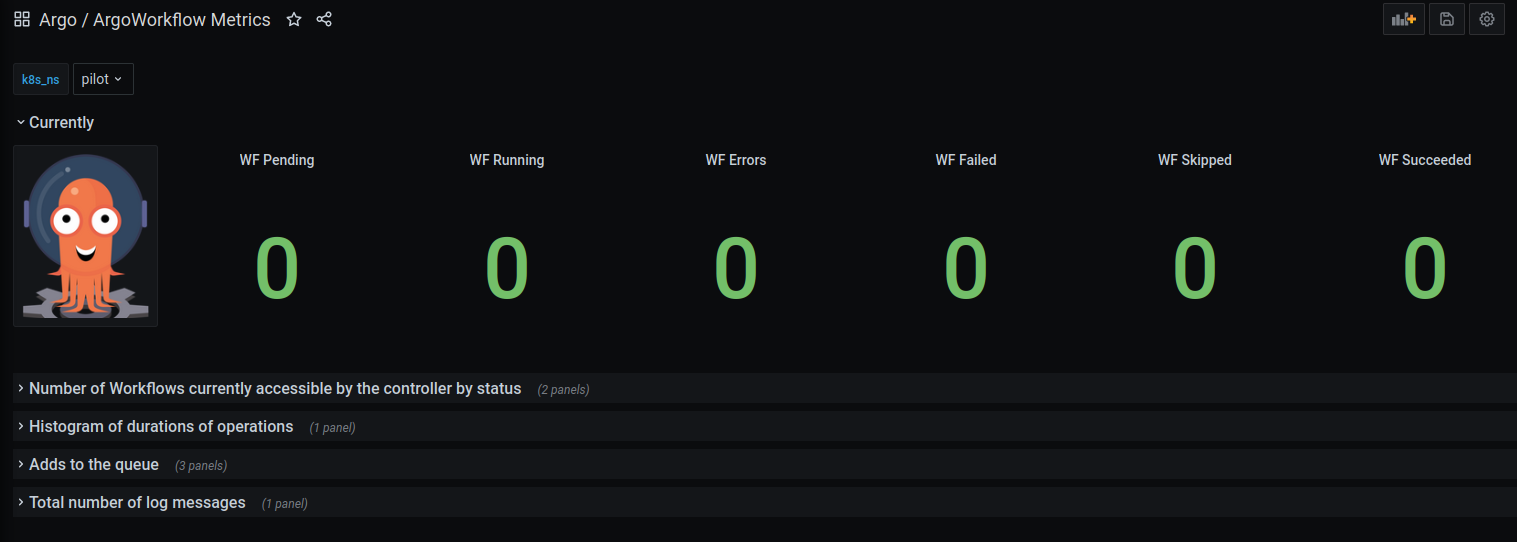
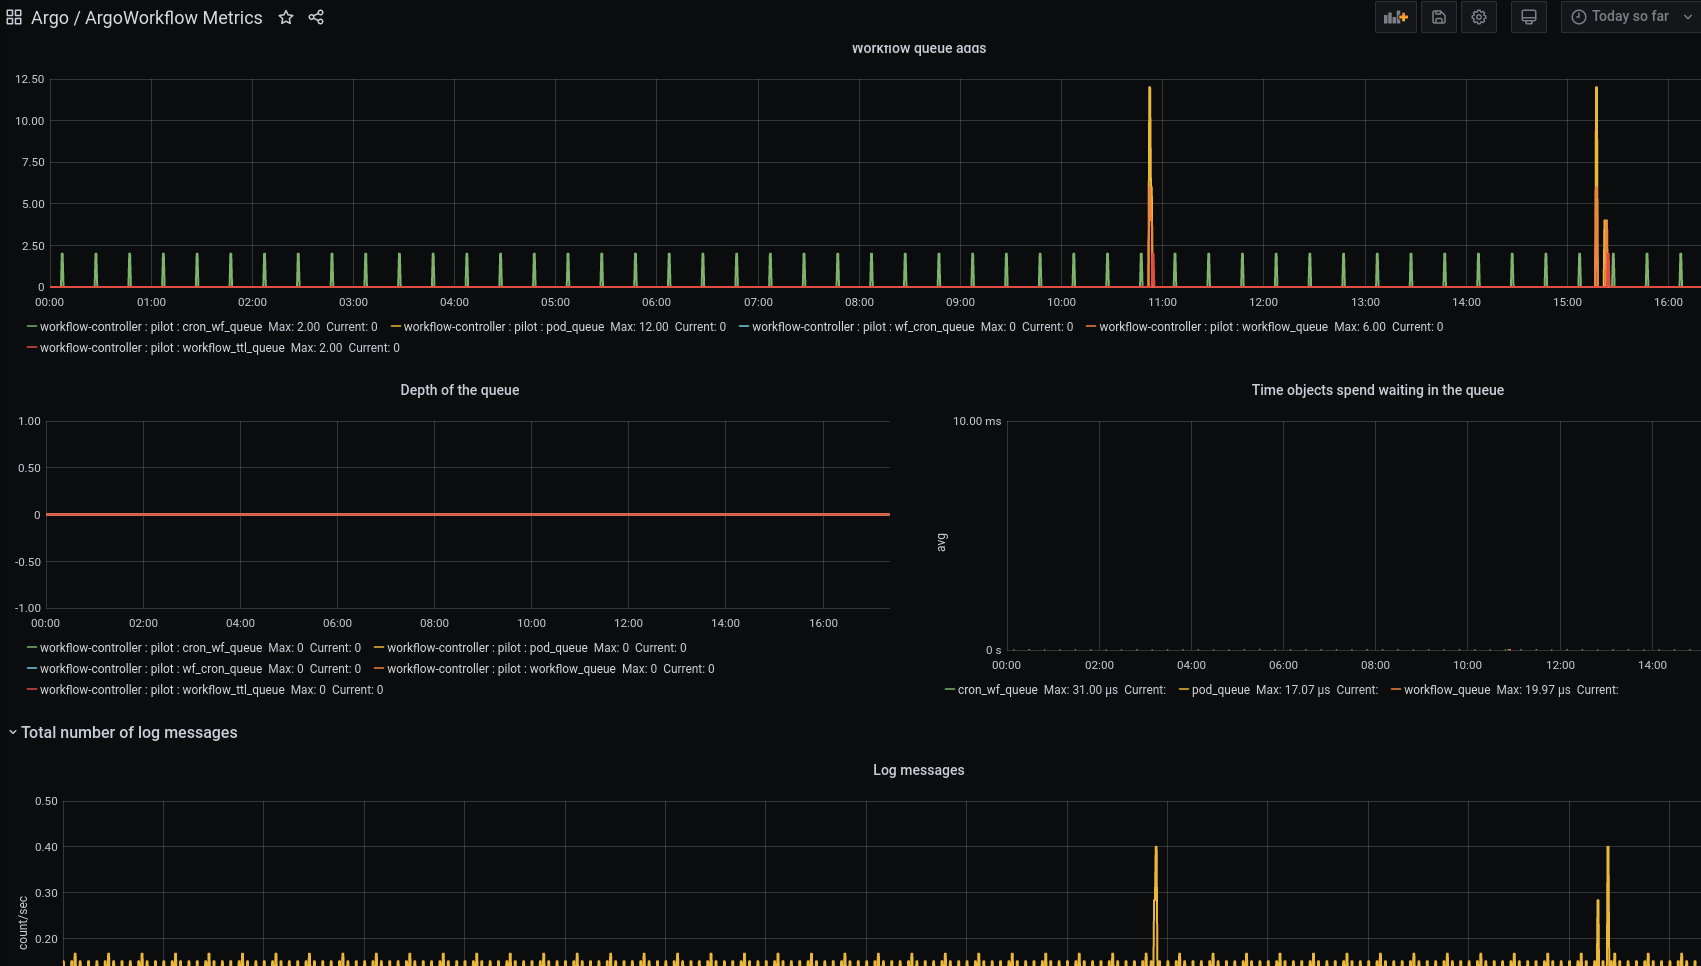
This dashboard monitors Argo Workflow activity and health by tracking workflow counts, durations, and queue dynamics. Key insights come from argo_workflows_count to show status distribution (Pending, Running, Succeeded, Failed, Skipped, Errors), argo_workflows_operation_duration_seconds_bucket for latency distribution of workflow operations, and argo_workflows_queue_depth_count / argo_workflows_queue_adds_count to assess queue growth and throughput. It also surfaces log messages for operational visibility and includes an alerting panel focused on Workflow Errors to flag issues in near real-time.
Screenshots
Used Metrics 77
argo_workflows_count
argo_workflows_operation_duration_seconds_bucket
argo_workflows_queue_adds_count
argo_workflows_queue_depth_count
argo_workflows_queue_latency_count
argo_workflows_queue_latency_sum
log_messages