ArgoCD 51,037,39651,037,396
6/14/2021
6/14/2021
1
>=8.0.0
Description
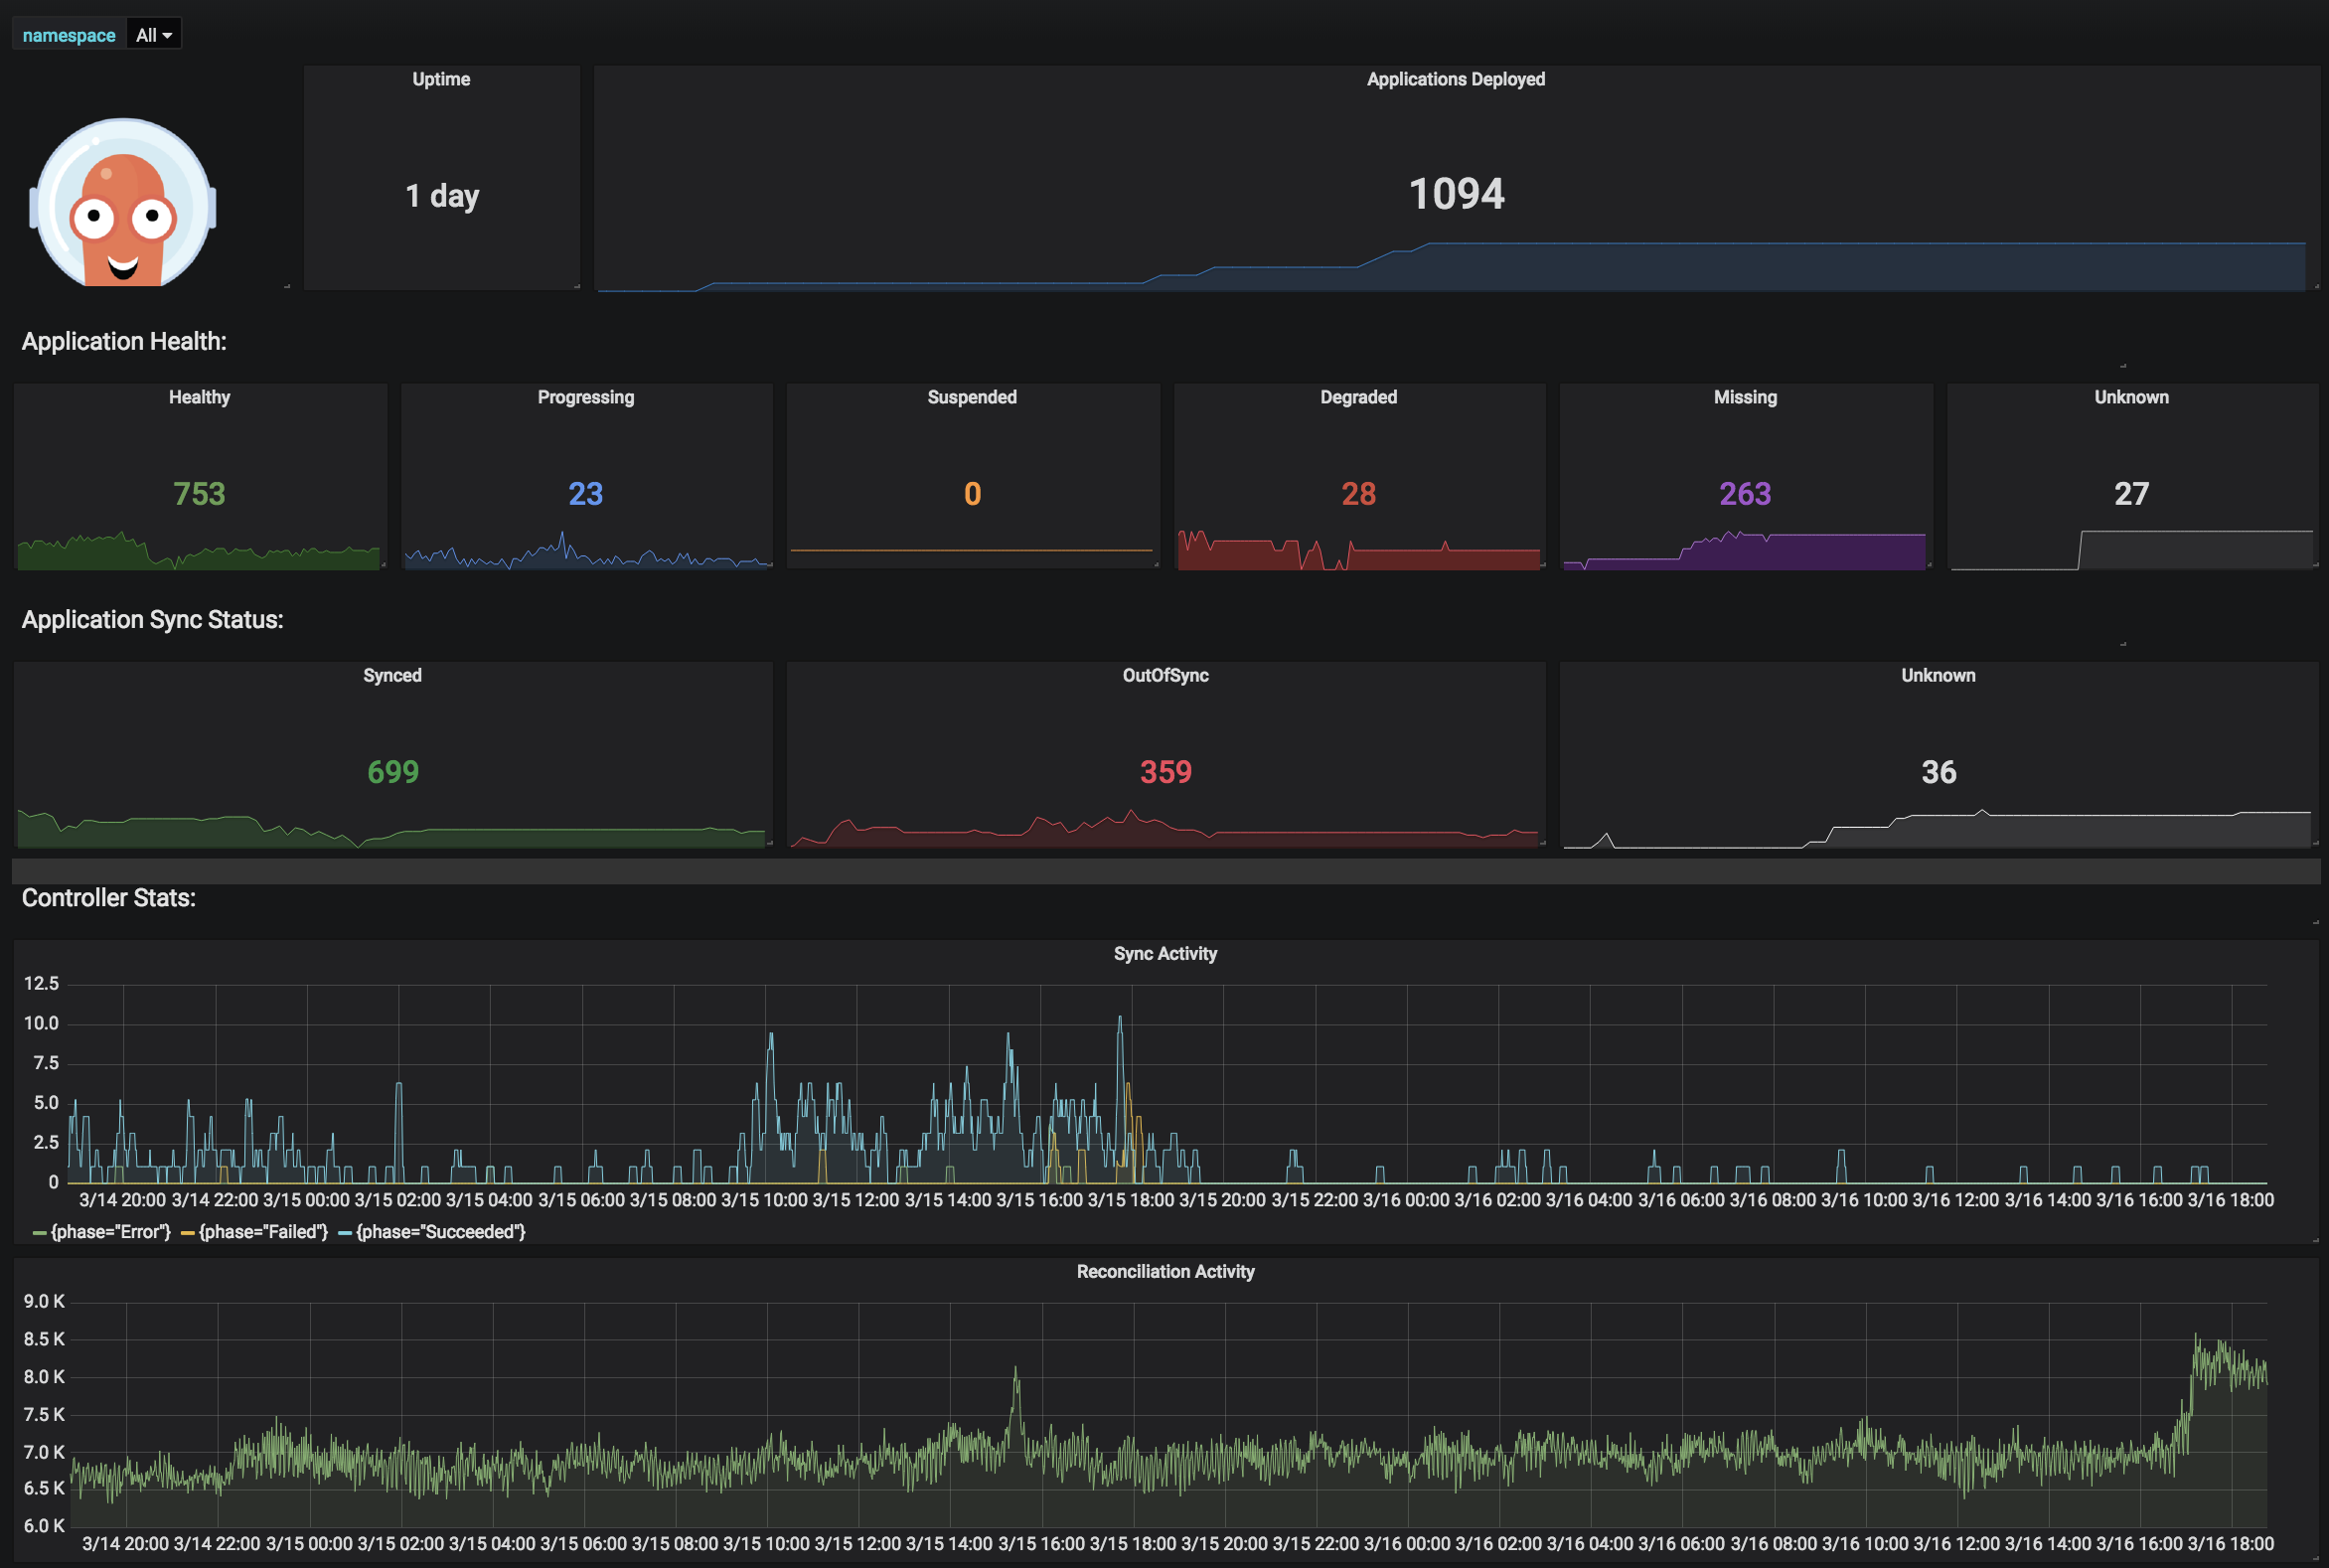
This Grafana dashboard provides a consolidated view of an ArgoCD control plane and its managed applications, exposing availability, cluster connectivity, repository sync status, application health, and ongoing operations. Panels combine time-series charts, status lists and counts to surface uptime and health trends, inventory of clusters/apps/repos, and operation metrics for troubleshooting, capacity planning and alerting.
Screenshots
Used Metrics 33
argocd_app_info
argocd_cluster_info
-
process_start_time_seconds
Get Dashboard✕
Download
Copy to Clipboard