APC PDU 7xxx 1,0091,009 4.5 (2 reviews)
4/26/2021
6/4/2021
4
>=7.5.7
Prometheus
Description
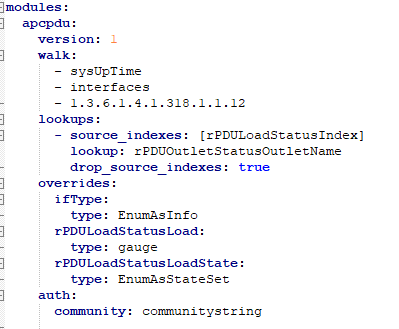
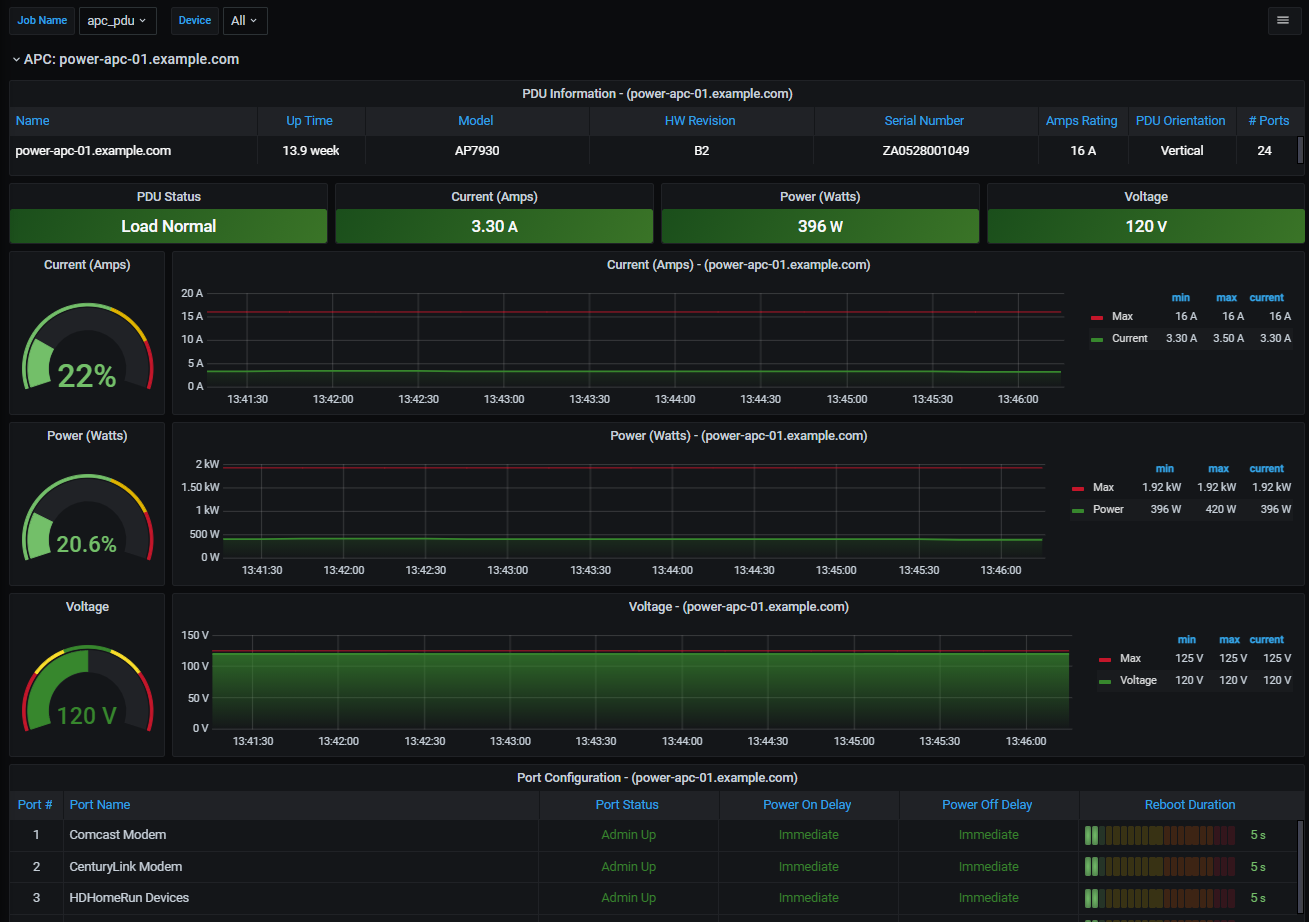
Displays monitoring data collected from APC power strips (PDU) via SNMP.
Screenshots
Used Metrics 1818
rPDUIdentDeviceLinetoLineVoltage
rPDUIdentDeviceNumOutlets
rPDUIdentDeviceOrientation
rPDUIdentDevicePowerWatts
rPDUIdentDeviceRating
rPDUIdentHardwareRev
rPDUIdentModelNumber
rPDUIdentSerialNumber
rPDULoadStatusLoad
rPDUOutletConfigIndex
rPDUOutletConfigOutletName
rPDUOutletConfigPowerOffTime
rPDUOutletConfigPowerOnTime
rPDUOutletConfigRebootDuration
rPDUOutletStatusIndex
rPDUOutletStatusOutletState
rPDUStatusPhaseState
sysUpTime
Get Dashboard✕
Download
Copy to Clipboard