Apache Traffic Server Dashboard 2,2442,244
8/13/2017
8/13/2017
1
Host Metrics
>=4.4.1
Prometheus
Description
Apache Traffic Server Monitoring Template
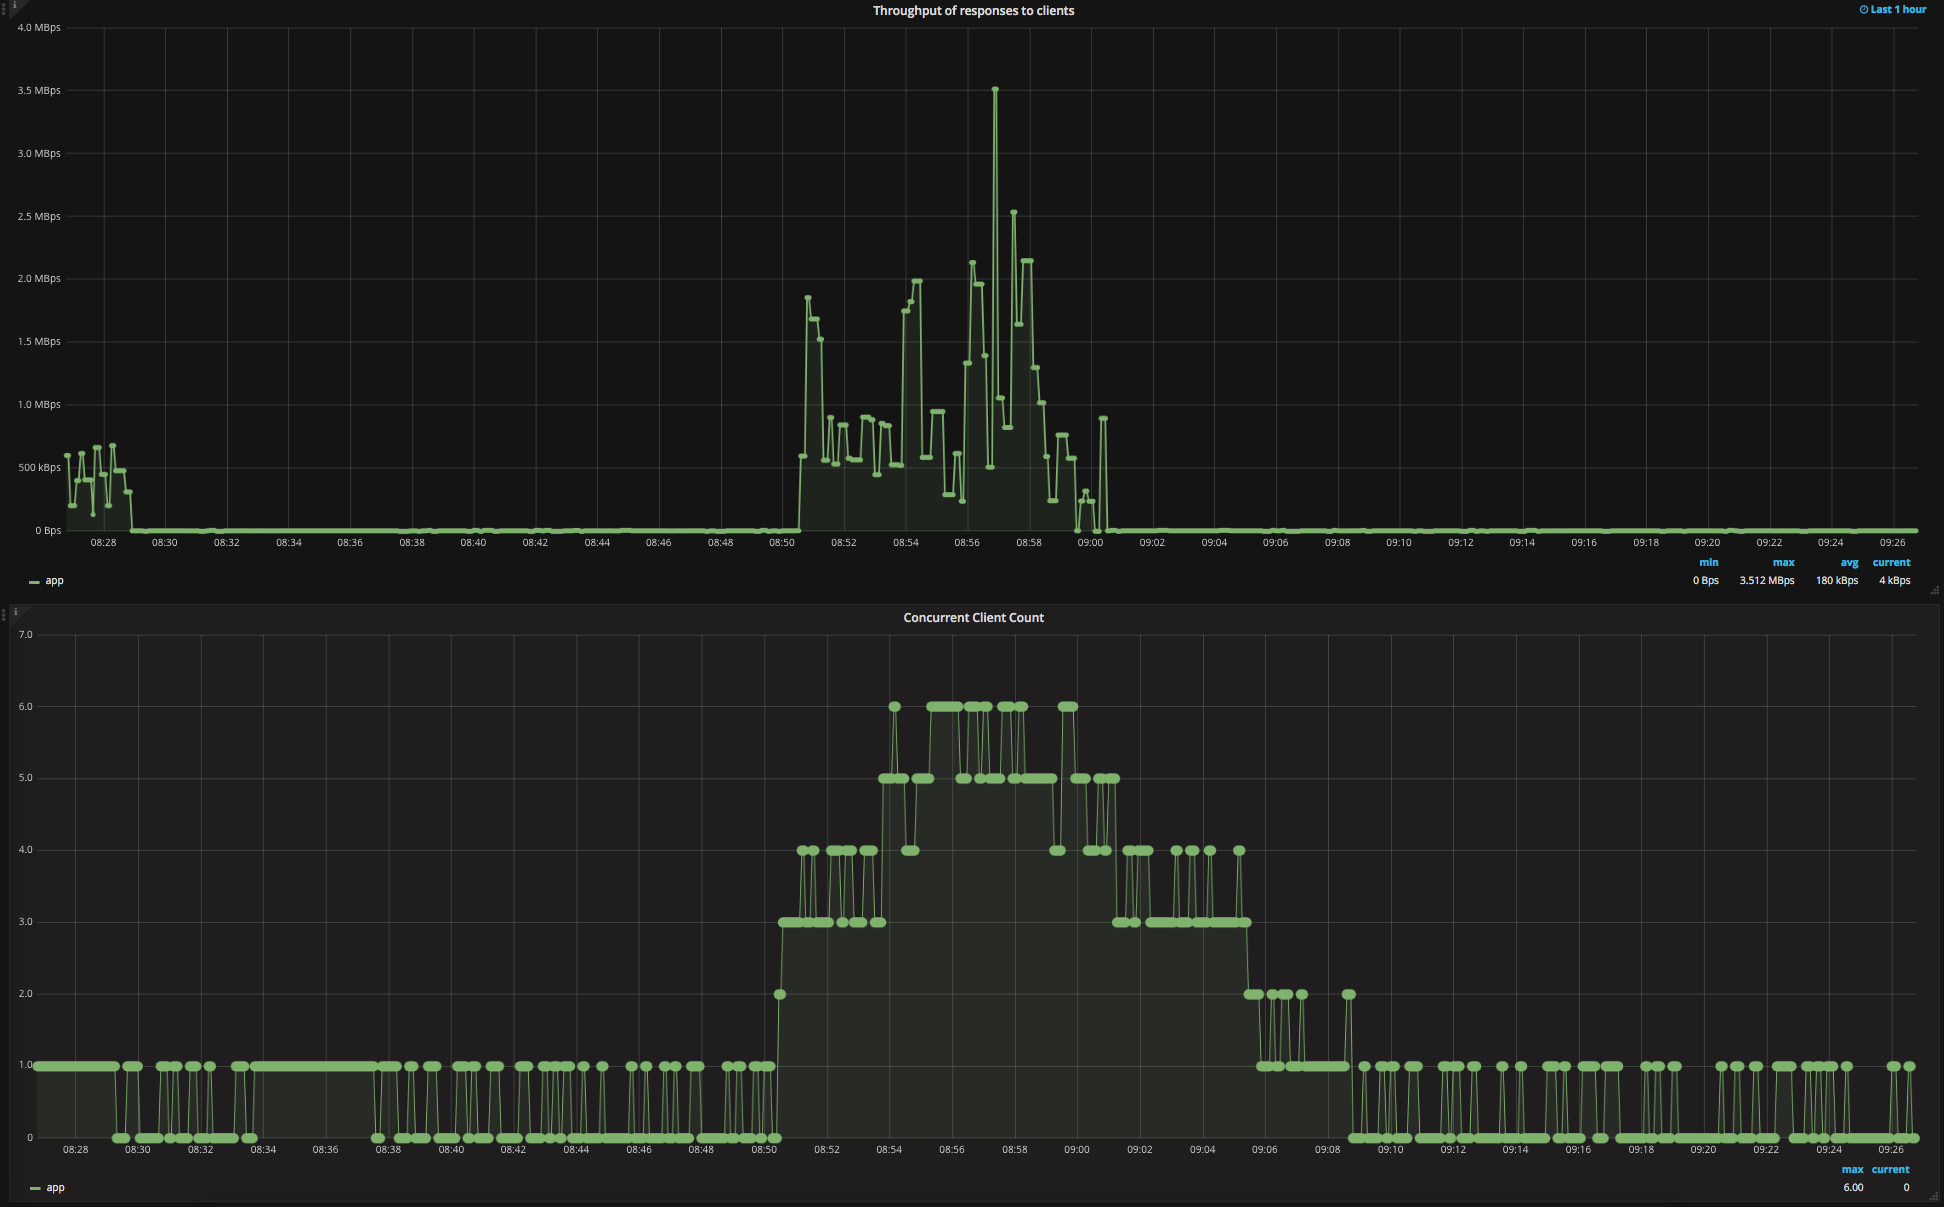
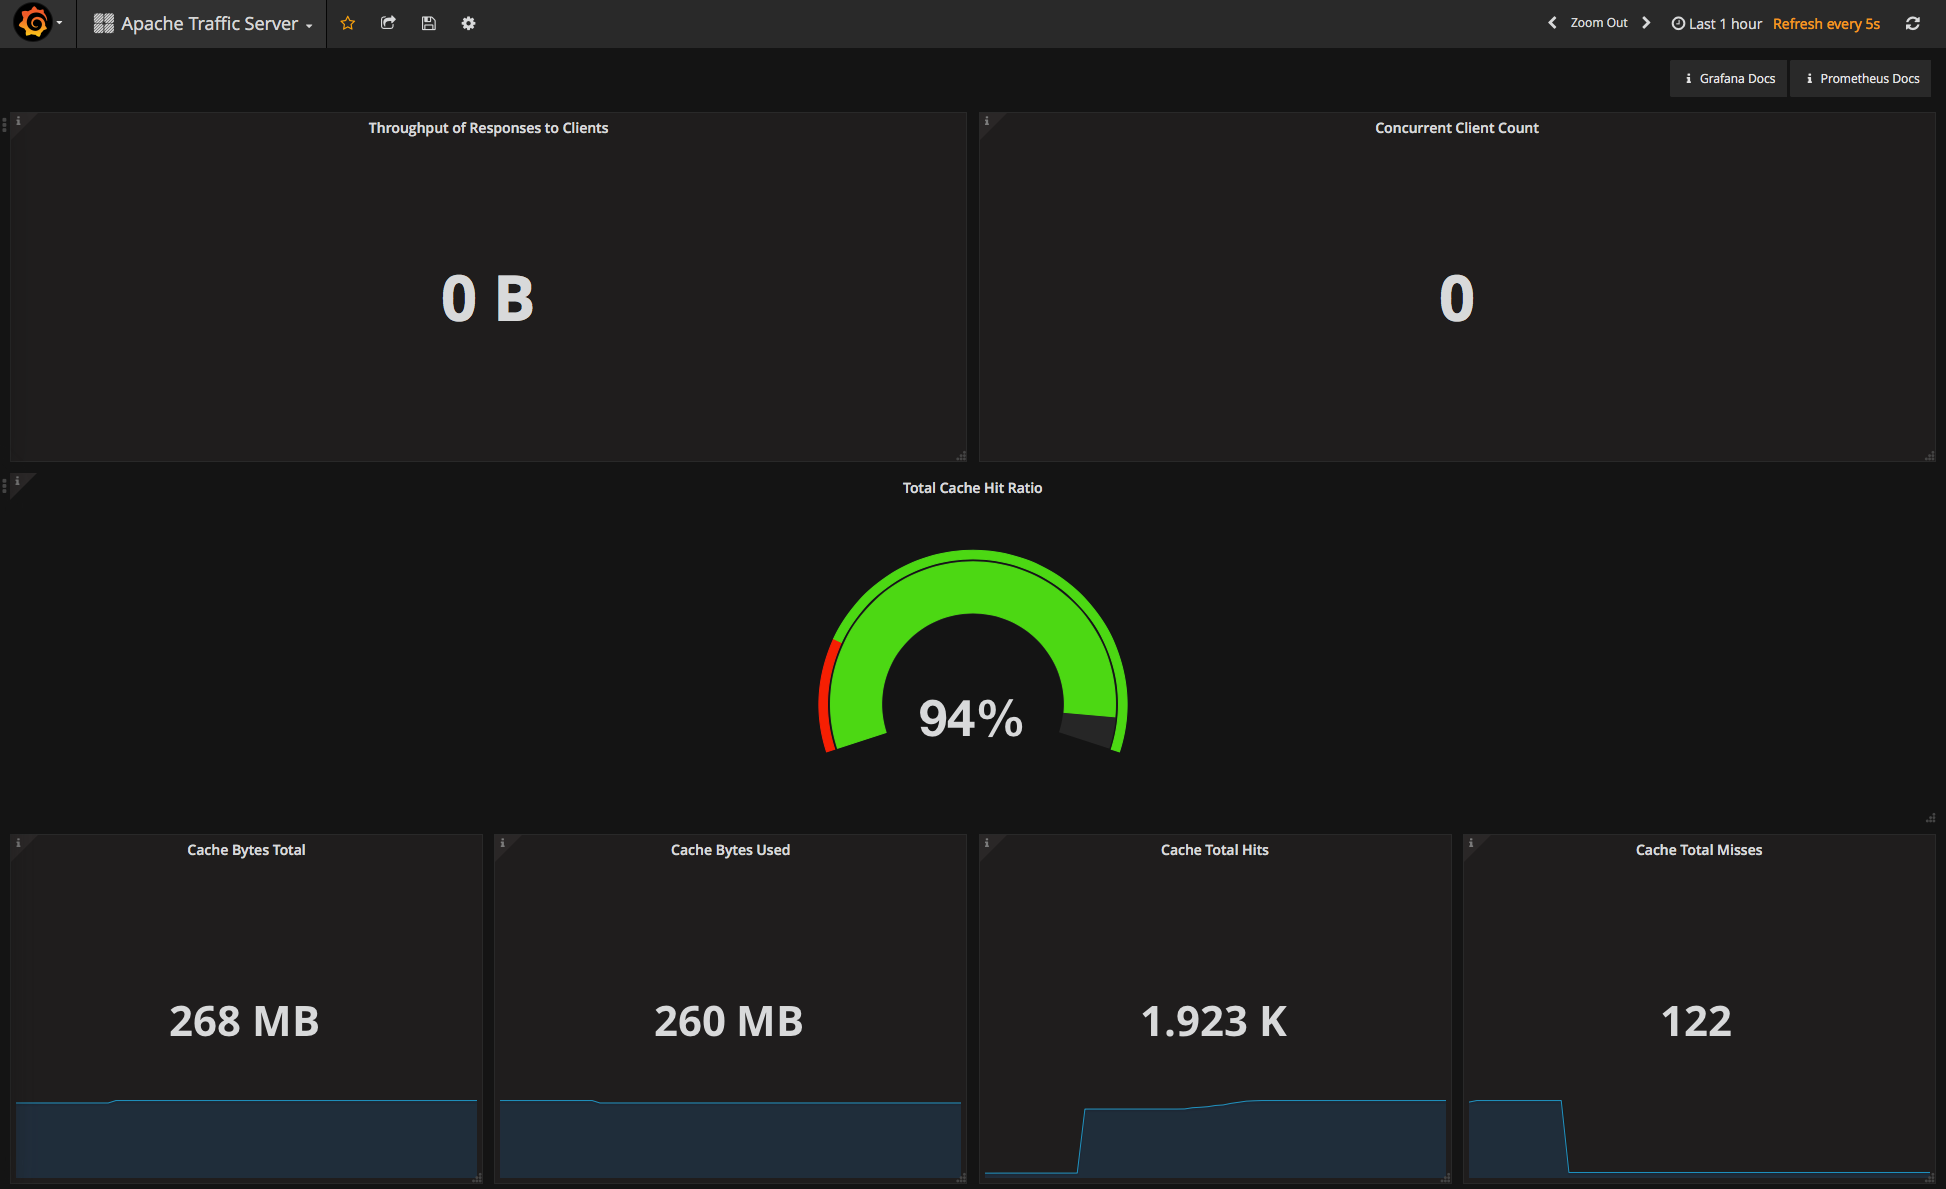
Screenshots
Get Dashboard✕
Download
Copy to Clipboard
Apache Traffic Server Monitoring Template