Apache Camel - Prometheus JMX Exporter 6,2276,227
7/9/2020
5/6/2023
1
>=5.4.3
Prometheus
Description
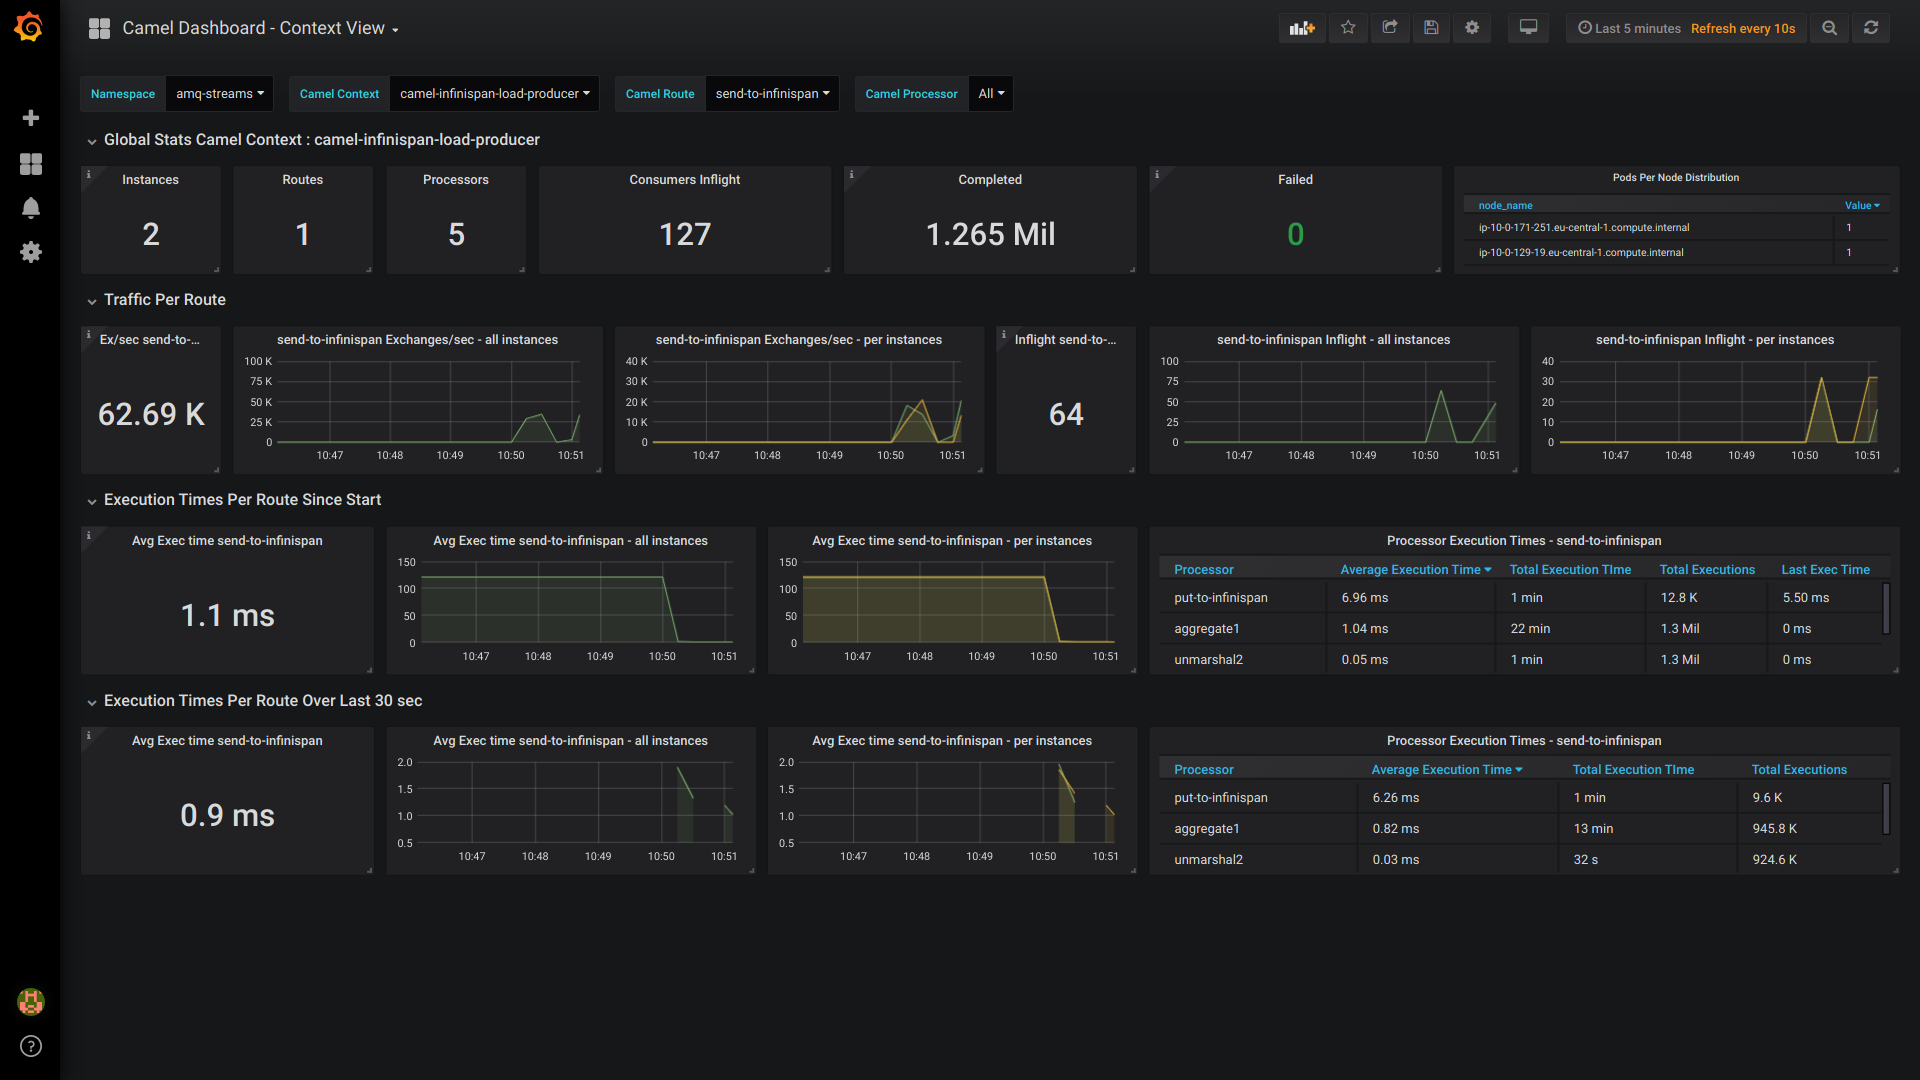
Performance oriented monitoring on Apache Camel deployments. Works ideally on Kubernetes deployments. Based on Prometheus datasource scraping JMX exporter metrics configured on Apache Camel JMX MBeans. Focuses on analyzing Camel Context, Route & Processor execution times and throughput.
- update 2023-05-06 : it's now prefered to use the dashboard based on micrometer metrics. It's the most up to date and the one that will be maintained in the future.
Screenshots
Used Metrics 66
org_apache_camel_ExchangesCompleted
org_apache_camel_ExchangesFailed
org_apache_camel_ExchangesTotal
org_apache_camel_InflightExchanges
org_apache_camel_Processor
topk
Get Dashboard✕
Download
Copy to Clipboard