Apache Artemis 1,8951,895
11/18/2018
11/18/2018
1
>=5.3.4
Prometheus
Description
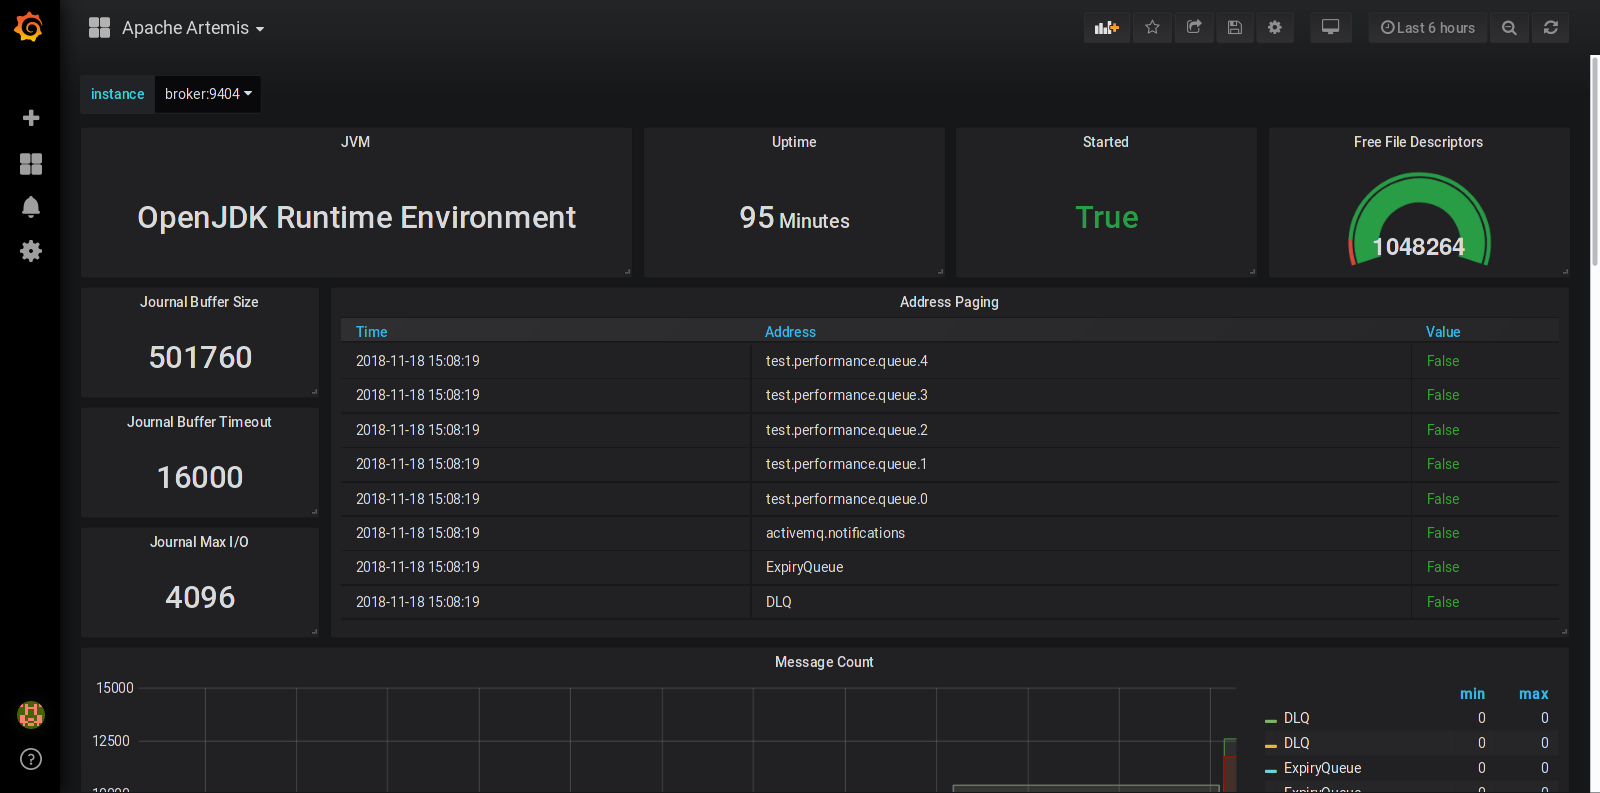
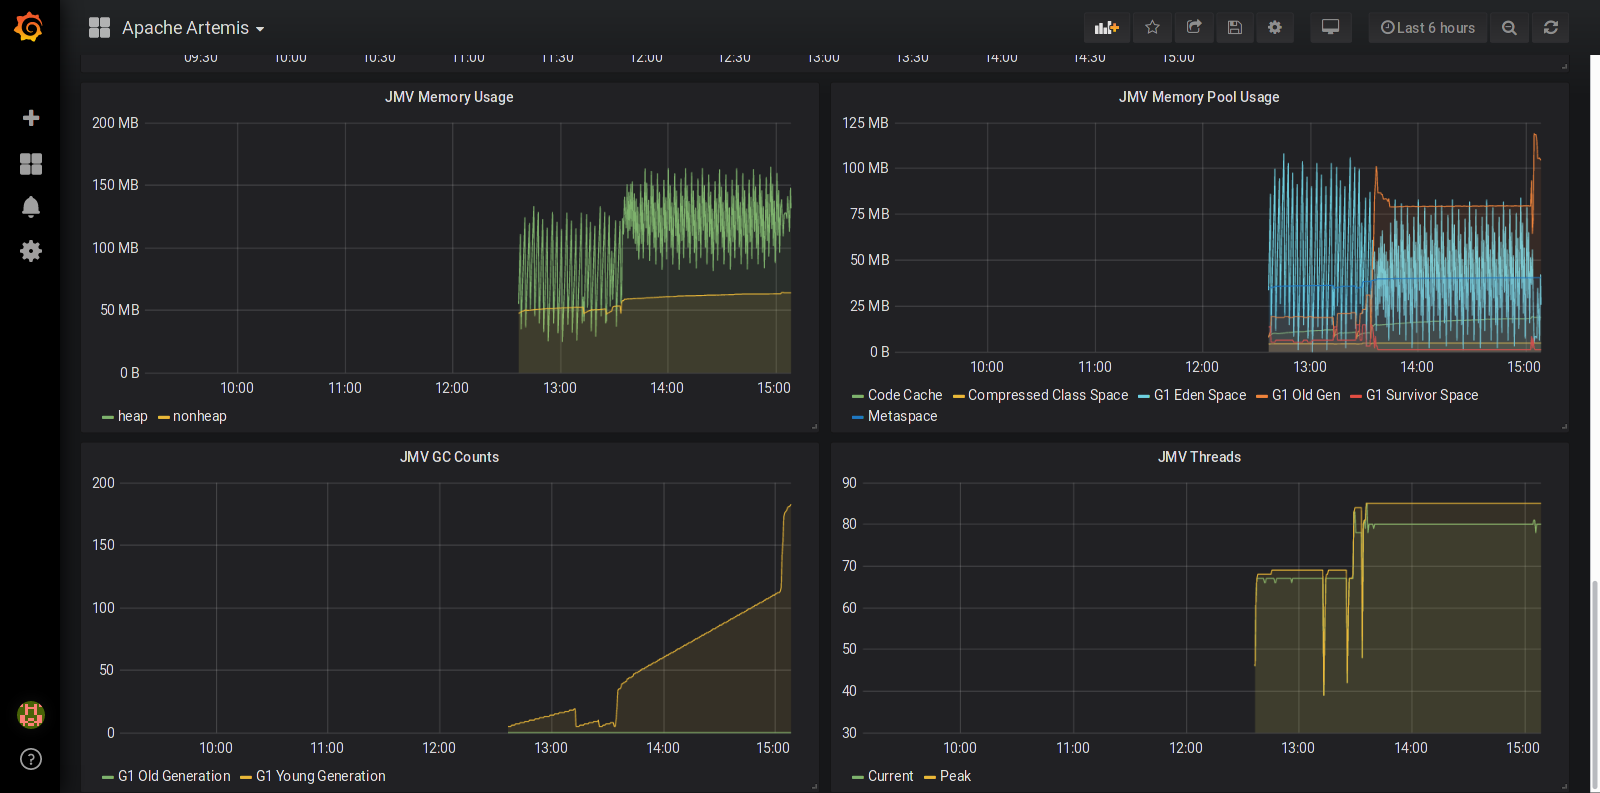
Dashboard for monitoring Apache Artemis
Screenshots
Used Metrics 1818
artemis_address_size
artemis_connection_count
artemis_consumer_count
artemis_journal_buffer_size
artemis_journal_buffer_timeout
artemis_journal_max_io
artemis_message_count
artemis_paging
artemis_started
artemis_uptime_millis
jvm_gc_collection_seconds_count
jvm_info
jvm_memory_bytes_used
jvm_memory_pool_bytes_used
jvm_threads_current
jvm_threads_peak
-
process_max_fds
-
process_open_fds
Get Dashboard✕
Download
Copy to Clipboard