Apache APISIX 58,01858,018 3.0 (1 reviews)
Description
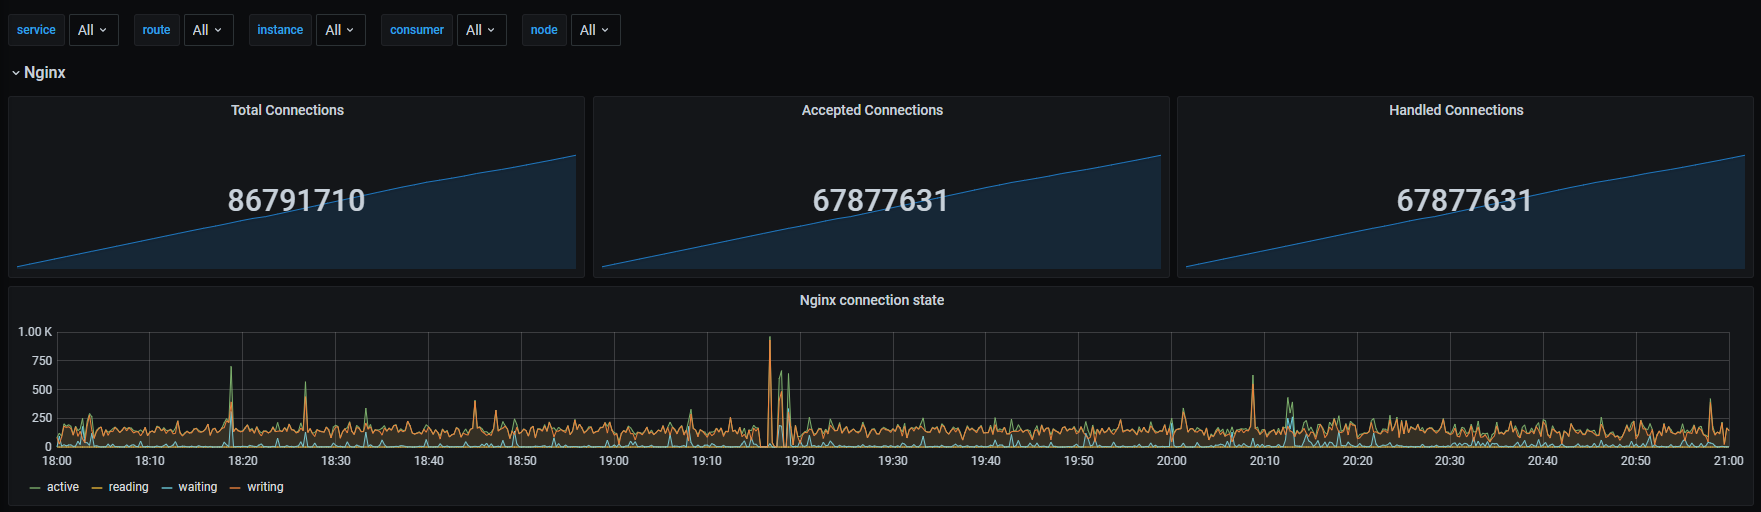
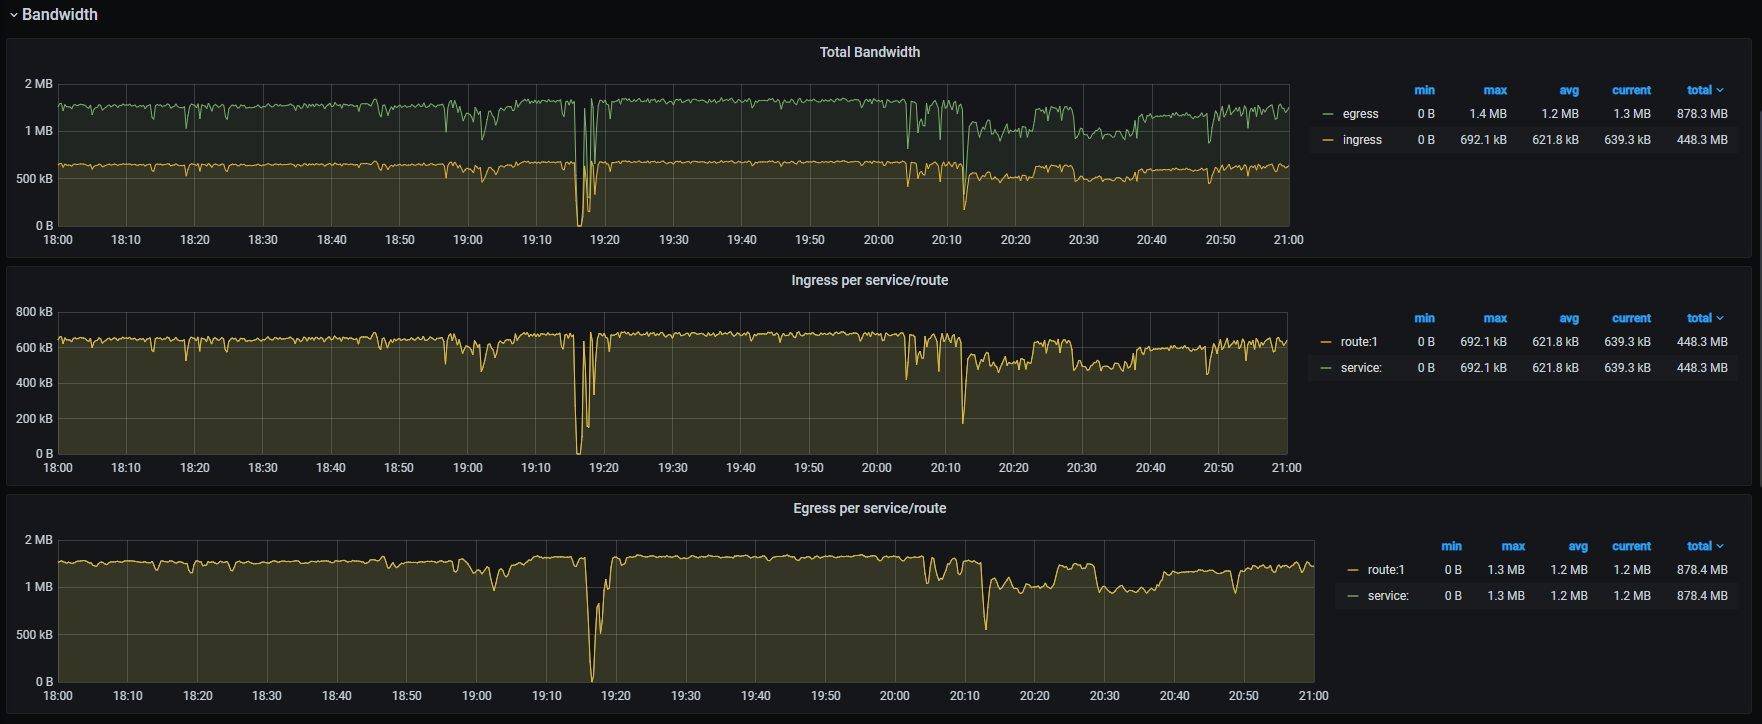
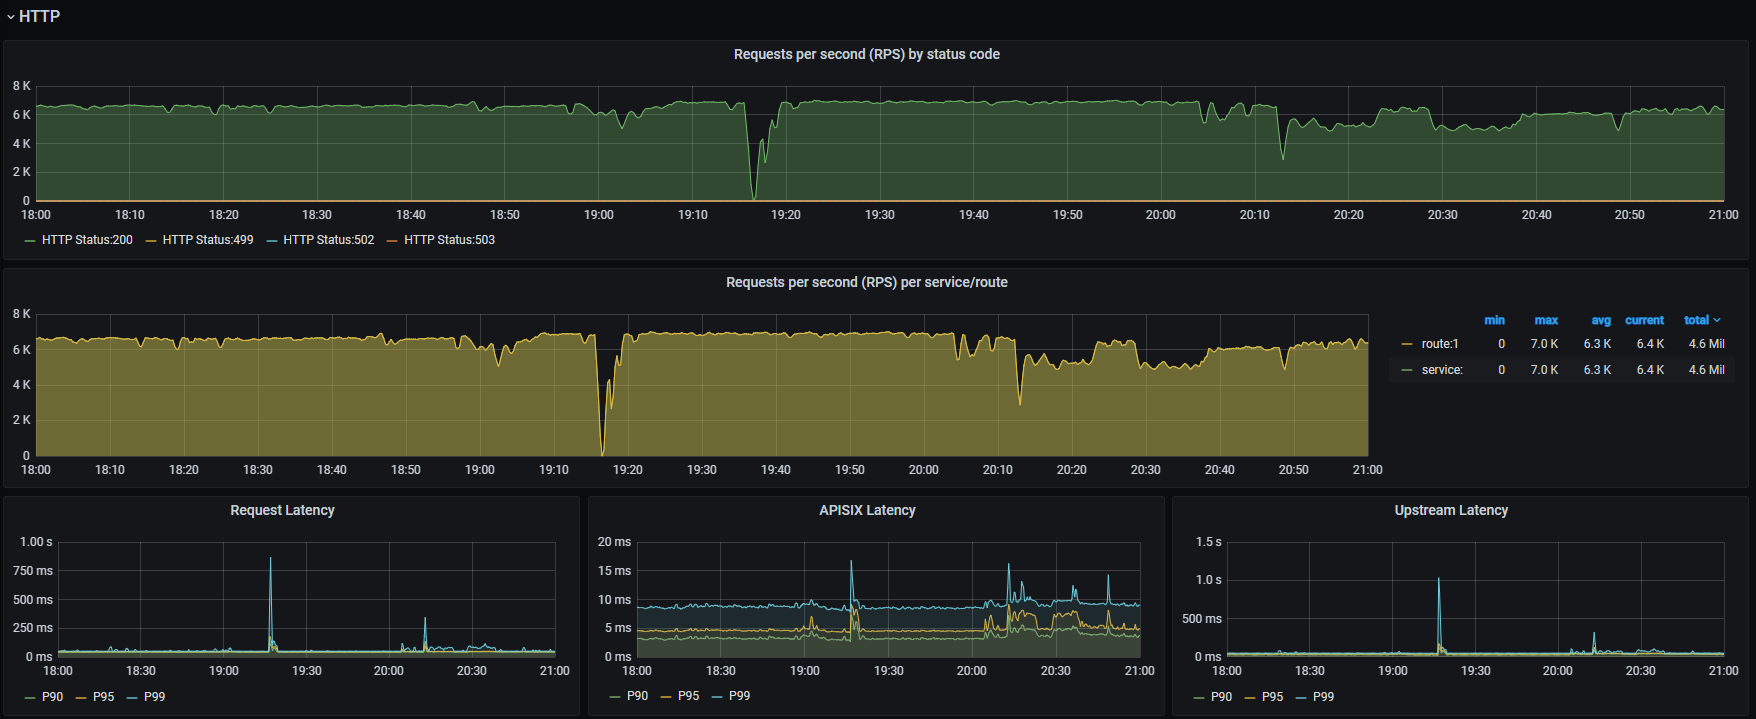
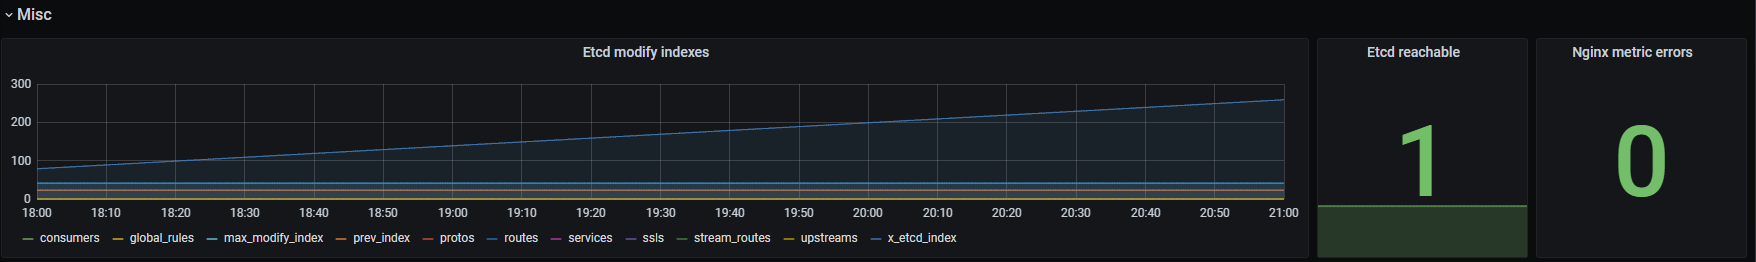
This dashboard monitors APISIX gateway performance and throughput, combining request metrics, latency breakdowns, and upstream and Nginx health indicators. It highlights key aspectos such as total request volume with apisix_http_requests_total, latency decomposition via apisix_http_latency_bucket and apisix_latency (APISIX, Upstream, and Nginx), and resource utilization like bandwidth, connection states, and shared dictionary space (apisix_bandwidth, apisix_nginx_http_current_connections, apisix_shared_dict_free_space_bytes). It also surfaces reliability signals through ETCD reachability/indexes (apisix_etcd_reachable, apisix_etcd_modify_indexes) and Nginx metric errors to help pinpoint operational issues across the gateway stack.
Screenshots
Used Metrics 1010
apisix_bandwidth
apisix_etcd_modify_indexes
apisix_etcd_reachable
apisix_http_latency_bucket
apisix_http_requests_total
apisix_http_status
apisix_nginx_http_current_connections
apisix_nginx_metric_errors_total
apisix_shared_dict_capacity_bytes
apisix_shared_dict_free_space_bytes