Analytics - NGINX / LOKI v2+ Data Source / Promtail v2+ Tool 9,7329,732 5.0 (2 reviews)
2/10/2021
6/24/2022
6
Docker
>=7.4.1
LokiPrometheus
Description
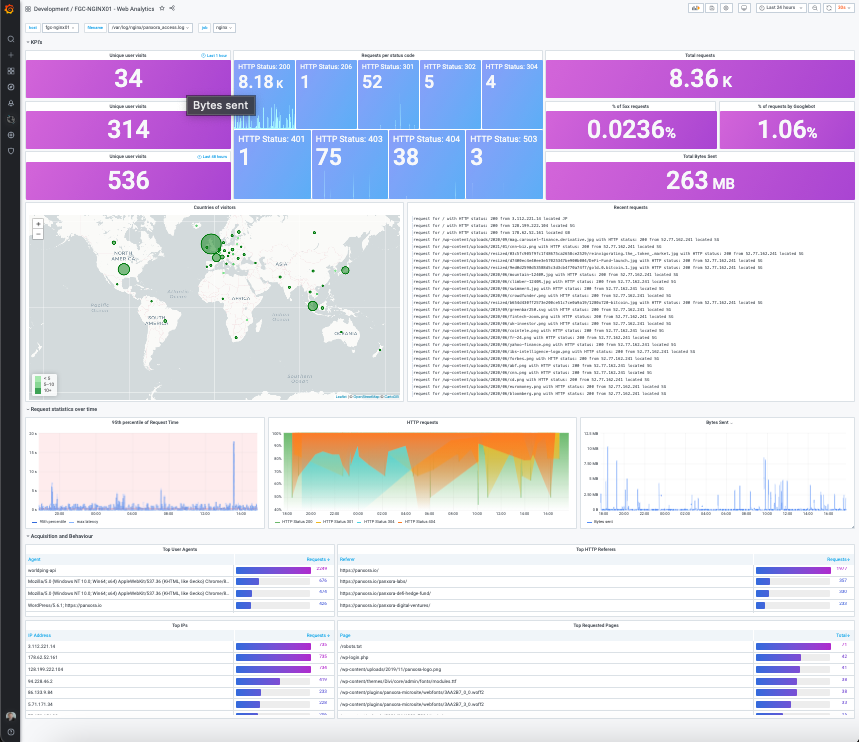
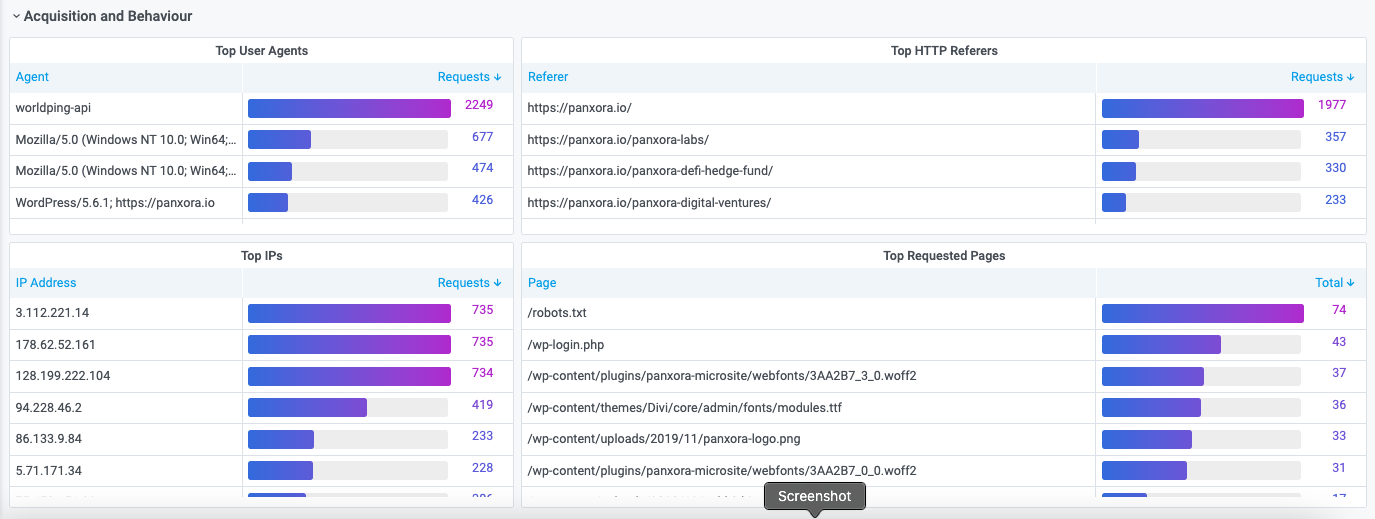
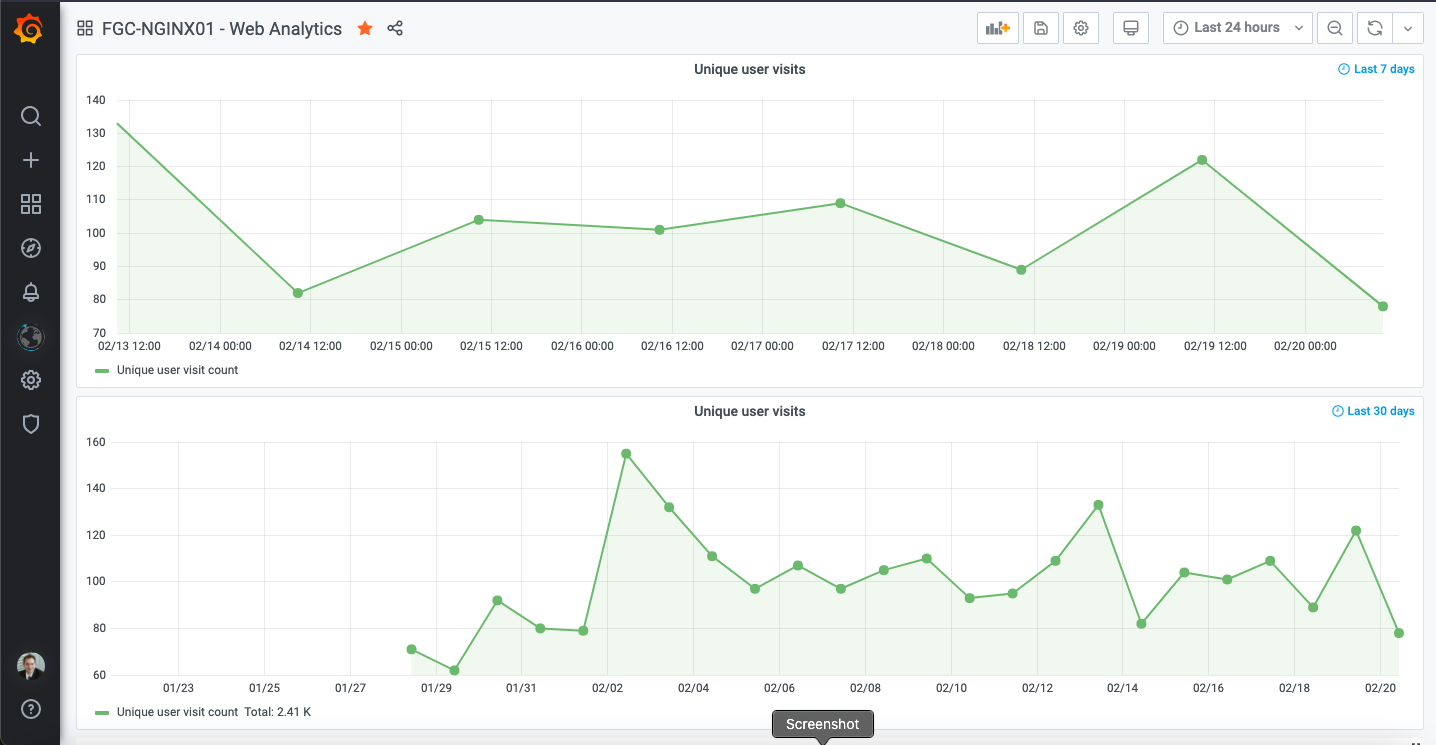
Nginx access log analytics dashboard using Promtail and Loki v2+. Prometheus datasource is created from Loki service.
Screenshots
Used Metrics 1616
:4ca0:108:42::
__error__
api
bot
crawler
http_user_agent
json
php
remote_addr
request_uri
robots
txt
wordfence
worldping
wp
xmlrpc
Get Dashboard✕
Download
Copy to Clipboard