Ambassador Edge Stack 11,69111,691
1/21/2021
1/21/2021
1
>=6.4.3
Prometheus
Description
Ambassador Edge Stack dashboard for Prometheus
Screenshots
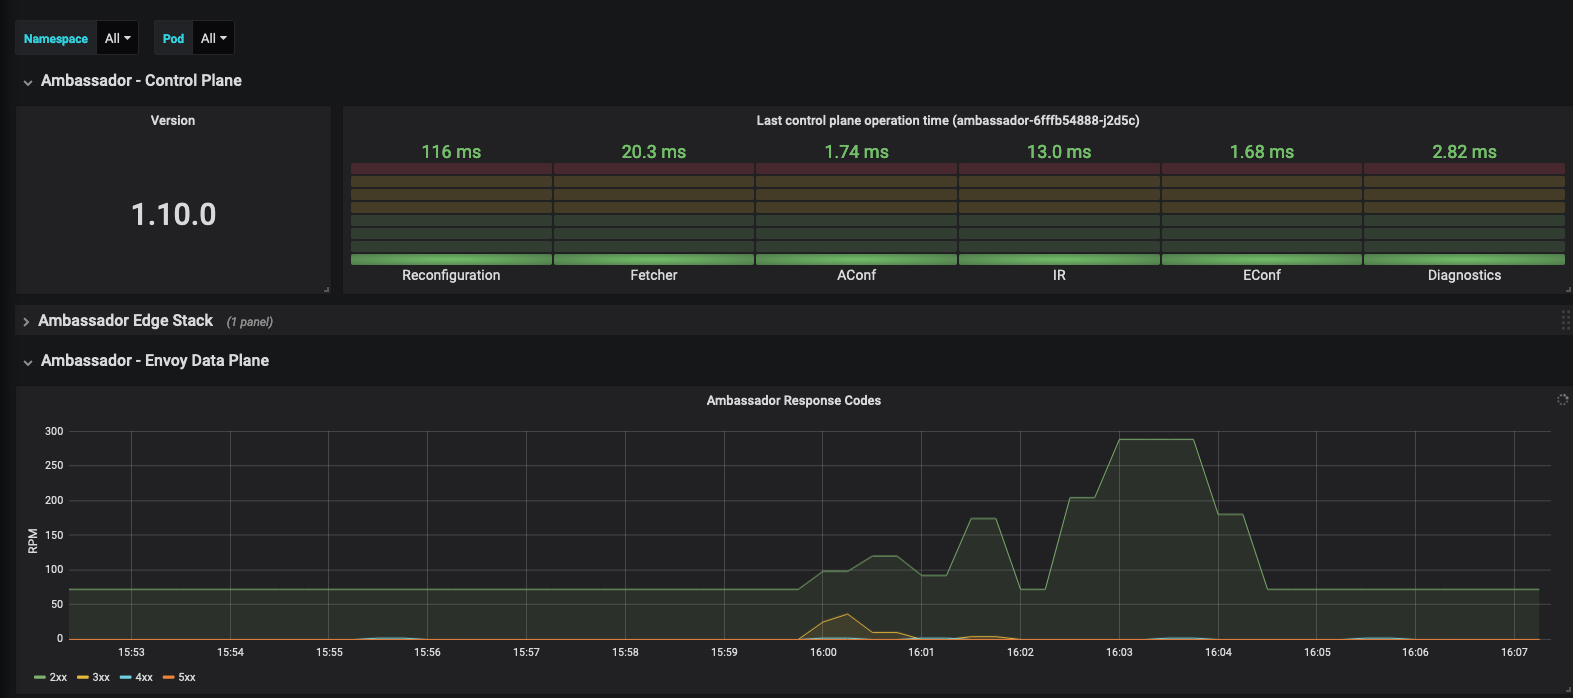
Used Metrics 1414
ambassador_aconf_time_seconds
ambassador_diagnostics_info
ambassador_diagnostics_time_seconds
ambassador_econf_time_seconds
ambassador_fetcher_time_seconds
ambassador_ir_time_seconds
ambassador_reconfiguration_time_seconds
envoy_cluster_manager_active_clusters
envoy_cluster_upstream_rq_xx
envoy_http_downstream_cx_http1_active
envoy_http_downstream_cx_http2_active_active
envoy_http_downstream_cx_length_ms_bucket
envoy_http_downstream_cx_upgrades_active
envoy_http_downstream_rq_xx
Get Dashboard✕
Download
Copy to Clipboard