All in one 854854
Description
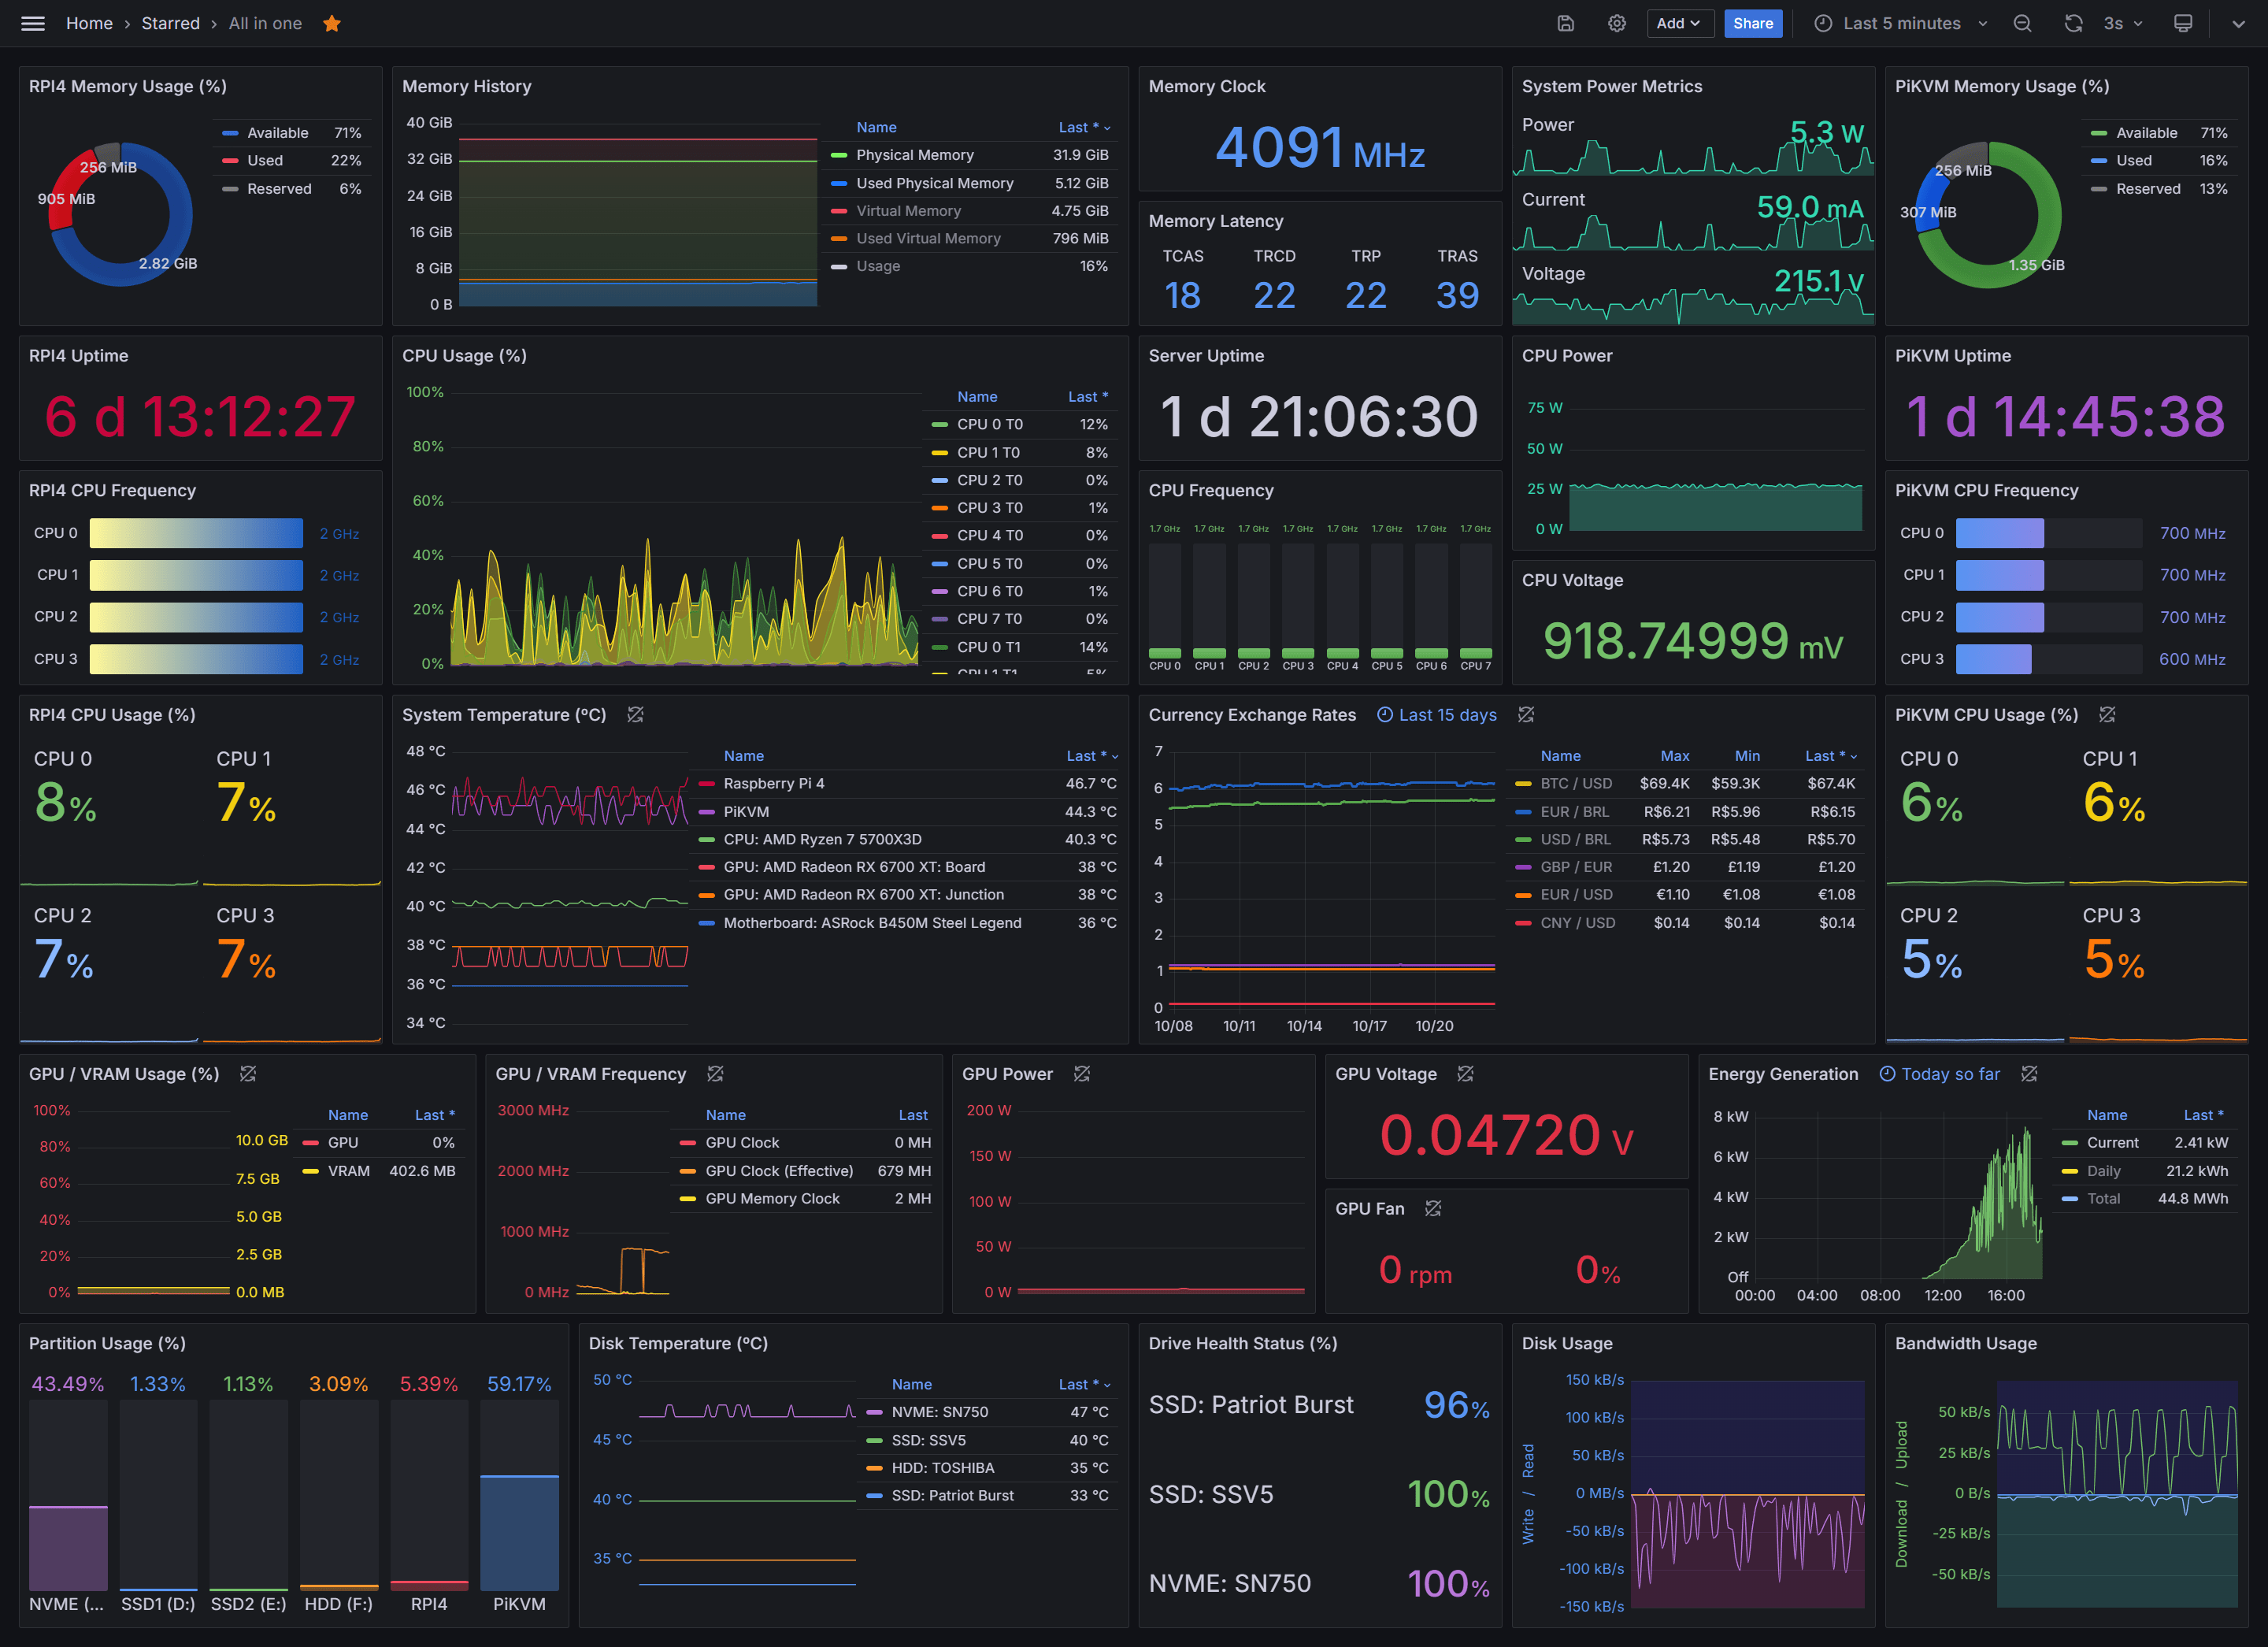
All in one dashboard that integrates data from various sources, including Raspberry Pi, Windows systems, PiKVM, Solis inverters, Tuya smart plugs, and more. Visualize system metrics, energy consumption, currency exchange rates, and solar power generation all in one place.
Screenshots
Used Metrics 5353
BTC_USD
CNY_USD
EUR_BRL
EUR_USD
GBP_EUR
USD_BRL
hwi_core_clock_mhz
hwi_core_usage
hwi_cpu_package_power_w
hwi_cpu_tctltdie_c
hwi_cpu_voltage_v
hwi_drive_read_rate_mbs
hwi_drive_remaining_life
hwi_drive_temperature_c
hwi_drive_write_rate_mbs
hwi_gpu_clock_mhz
hwi_gpu_core_voltage_v
hwi_gpu_d_memory_dedicated_mb
hwi_gpu_d_usage
hwi_gpu_fan
hwi_gpu_fan_rpm
hwi_gpu_hot_spot_temperature_c
hwi_gpu_memory_clock_mhz
hwi_gpu_ppt_w
hwi_gpu_temperature_c
hwi_memory_available_mb
hwi_memory_clock_mhz
hwi_memory_load
hwi_memory_tcas_t
hwi_memory_tras_t
hwi_memory_trcd_t
hwi_memory_trp_t
hwi_memory_used_mb
hwi_motherboard_c
hwi_network_dl_rate_kbs
hwi_network_up_rate_kbs
hwi_virtual_memory_committed_mb
inverter_energy_today
inverter_energy_total
inverter_power
-
node_cpu_scaling_frequency_hertz
-
node_cpu_seconds_total
-
node_filesystem_free_bytes
-
node_filesystem_size_bytes
-
node_memory_MemAvailable_bytes
-
node_memory_MemTotal_bytes
node_thermal_zone_temp
tuya_consumption_current
tuya_consumption_power
tuya_consumption_voltage
windows_logical_disk_free_bytes
windows_logical_disk_size_bytes
windows_system_system_up_time