Akka Actor System - Kamon 1,881,6141,881,614
Description
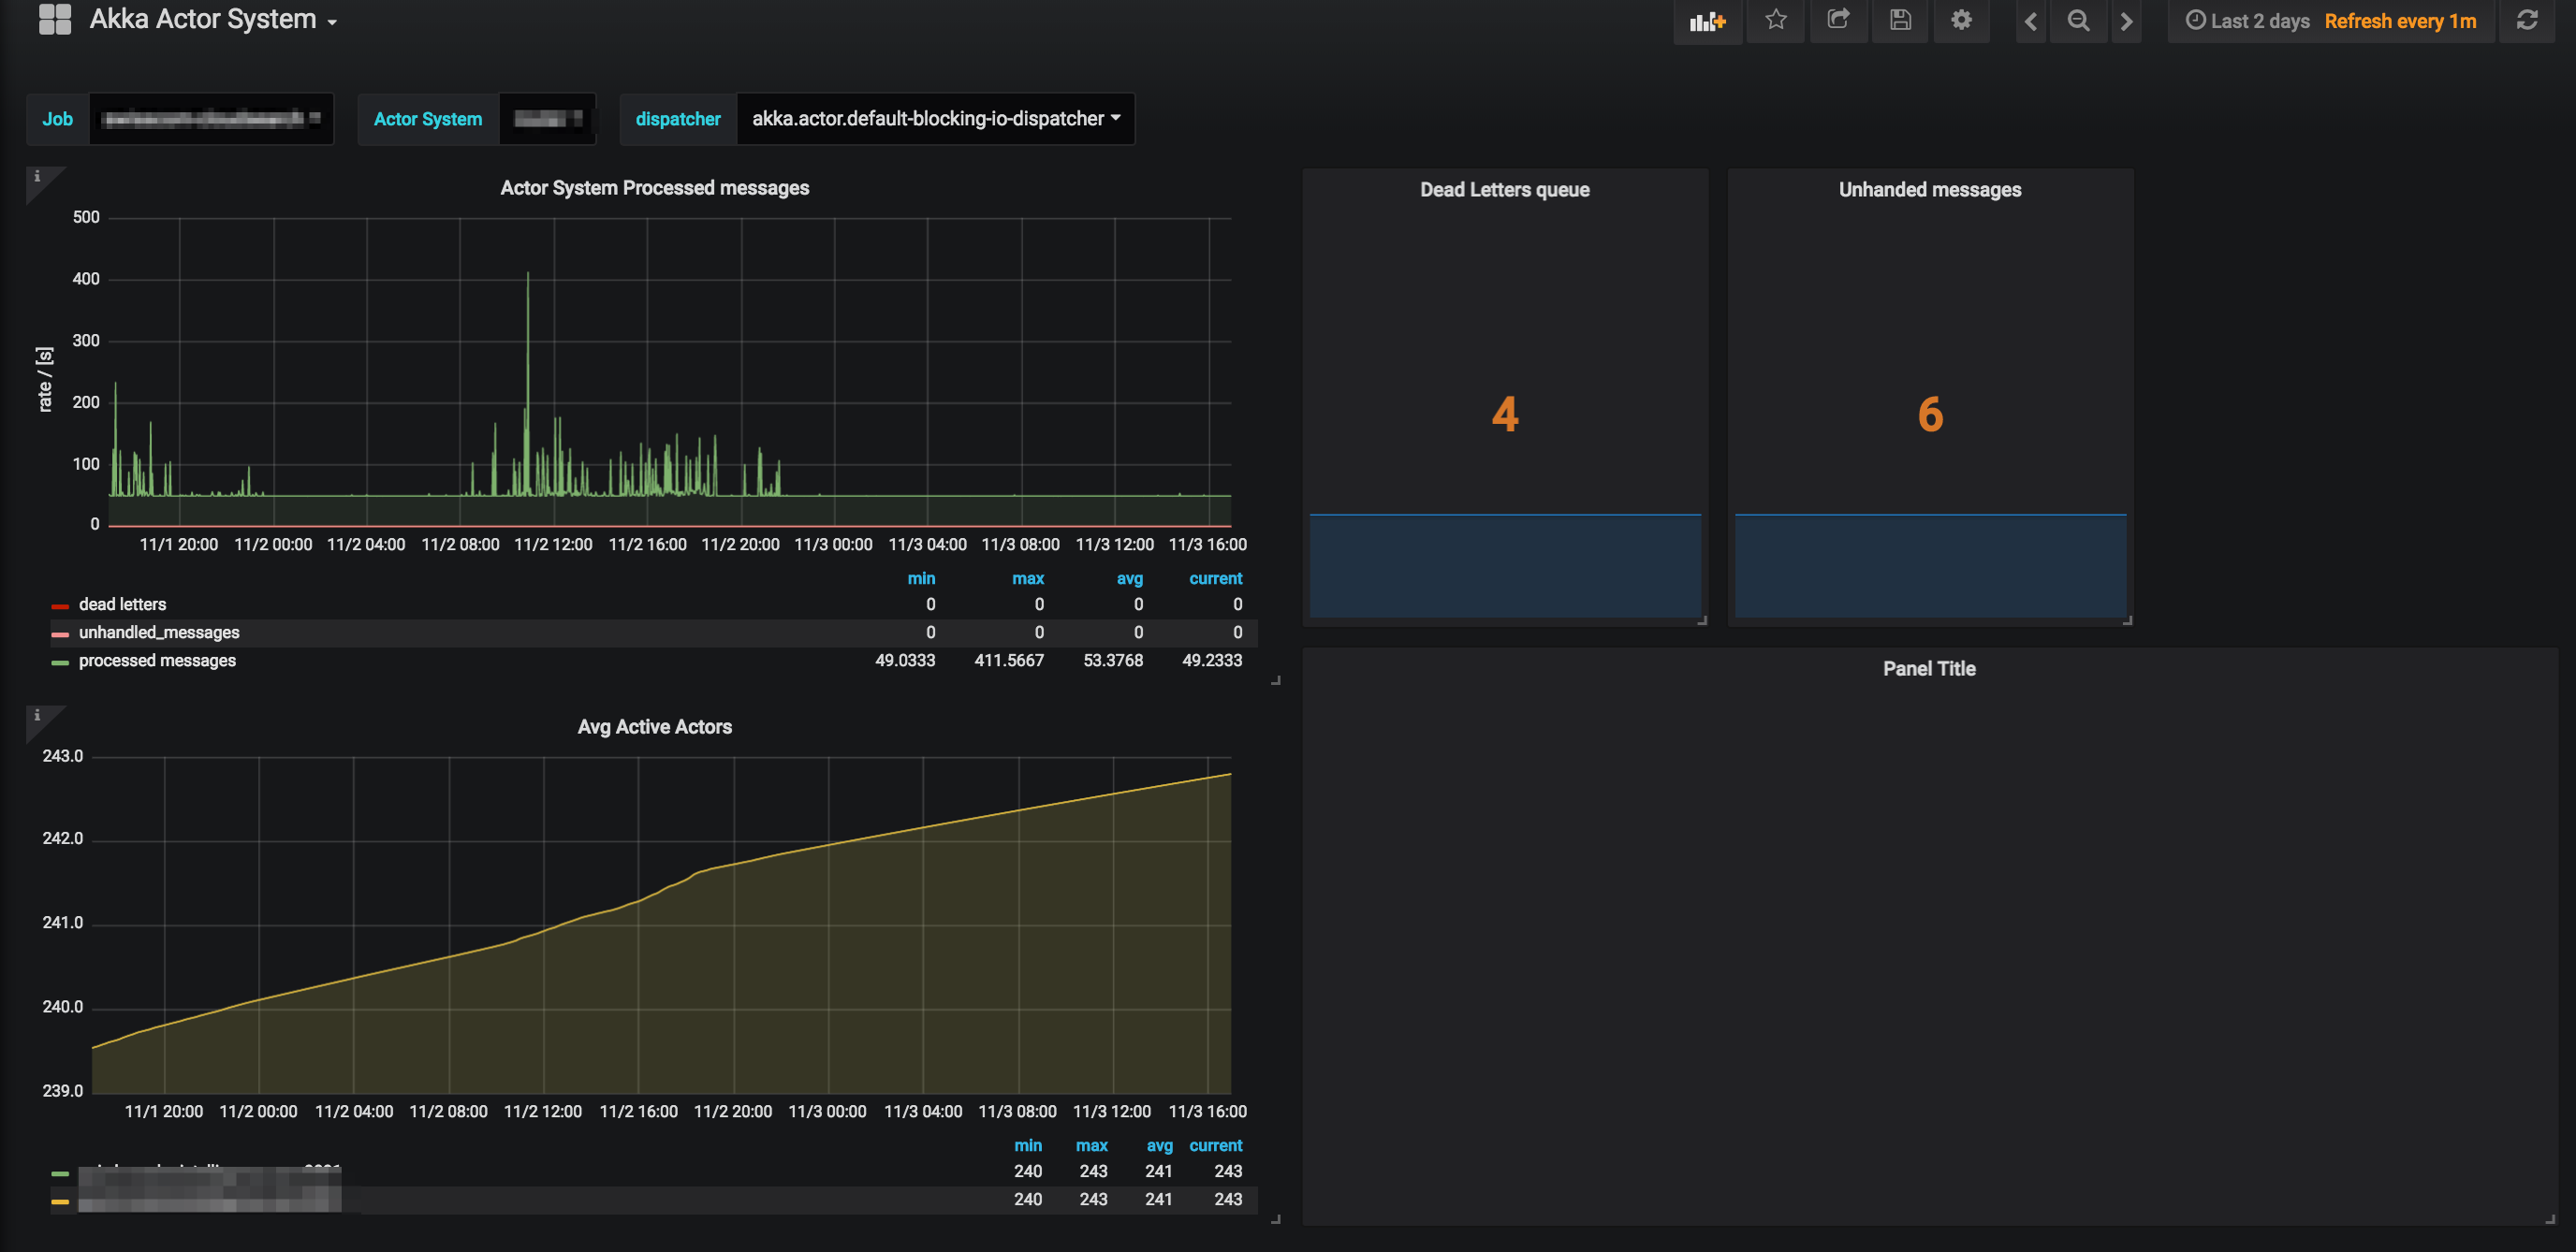
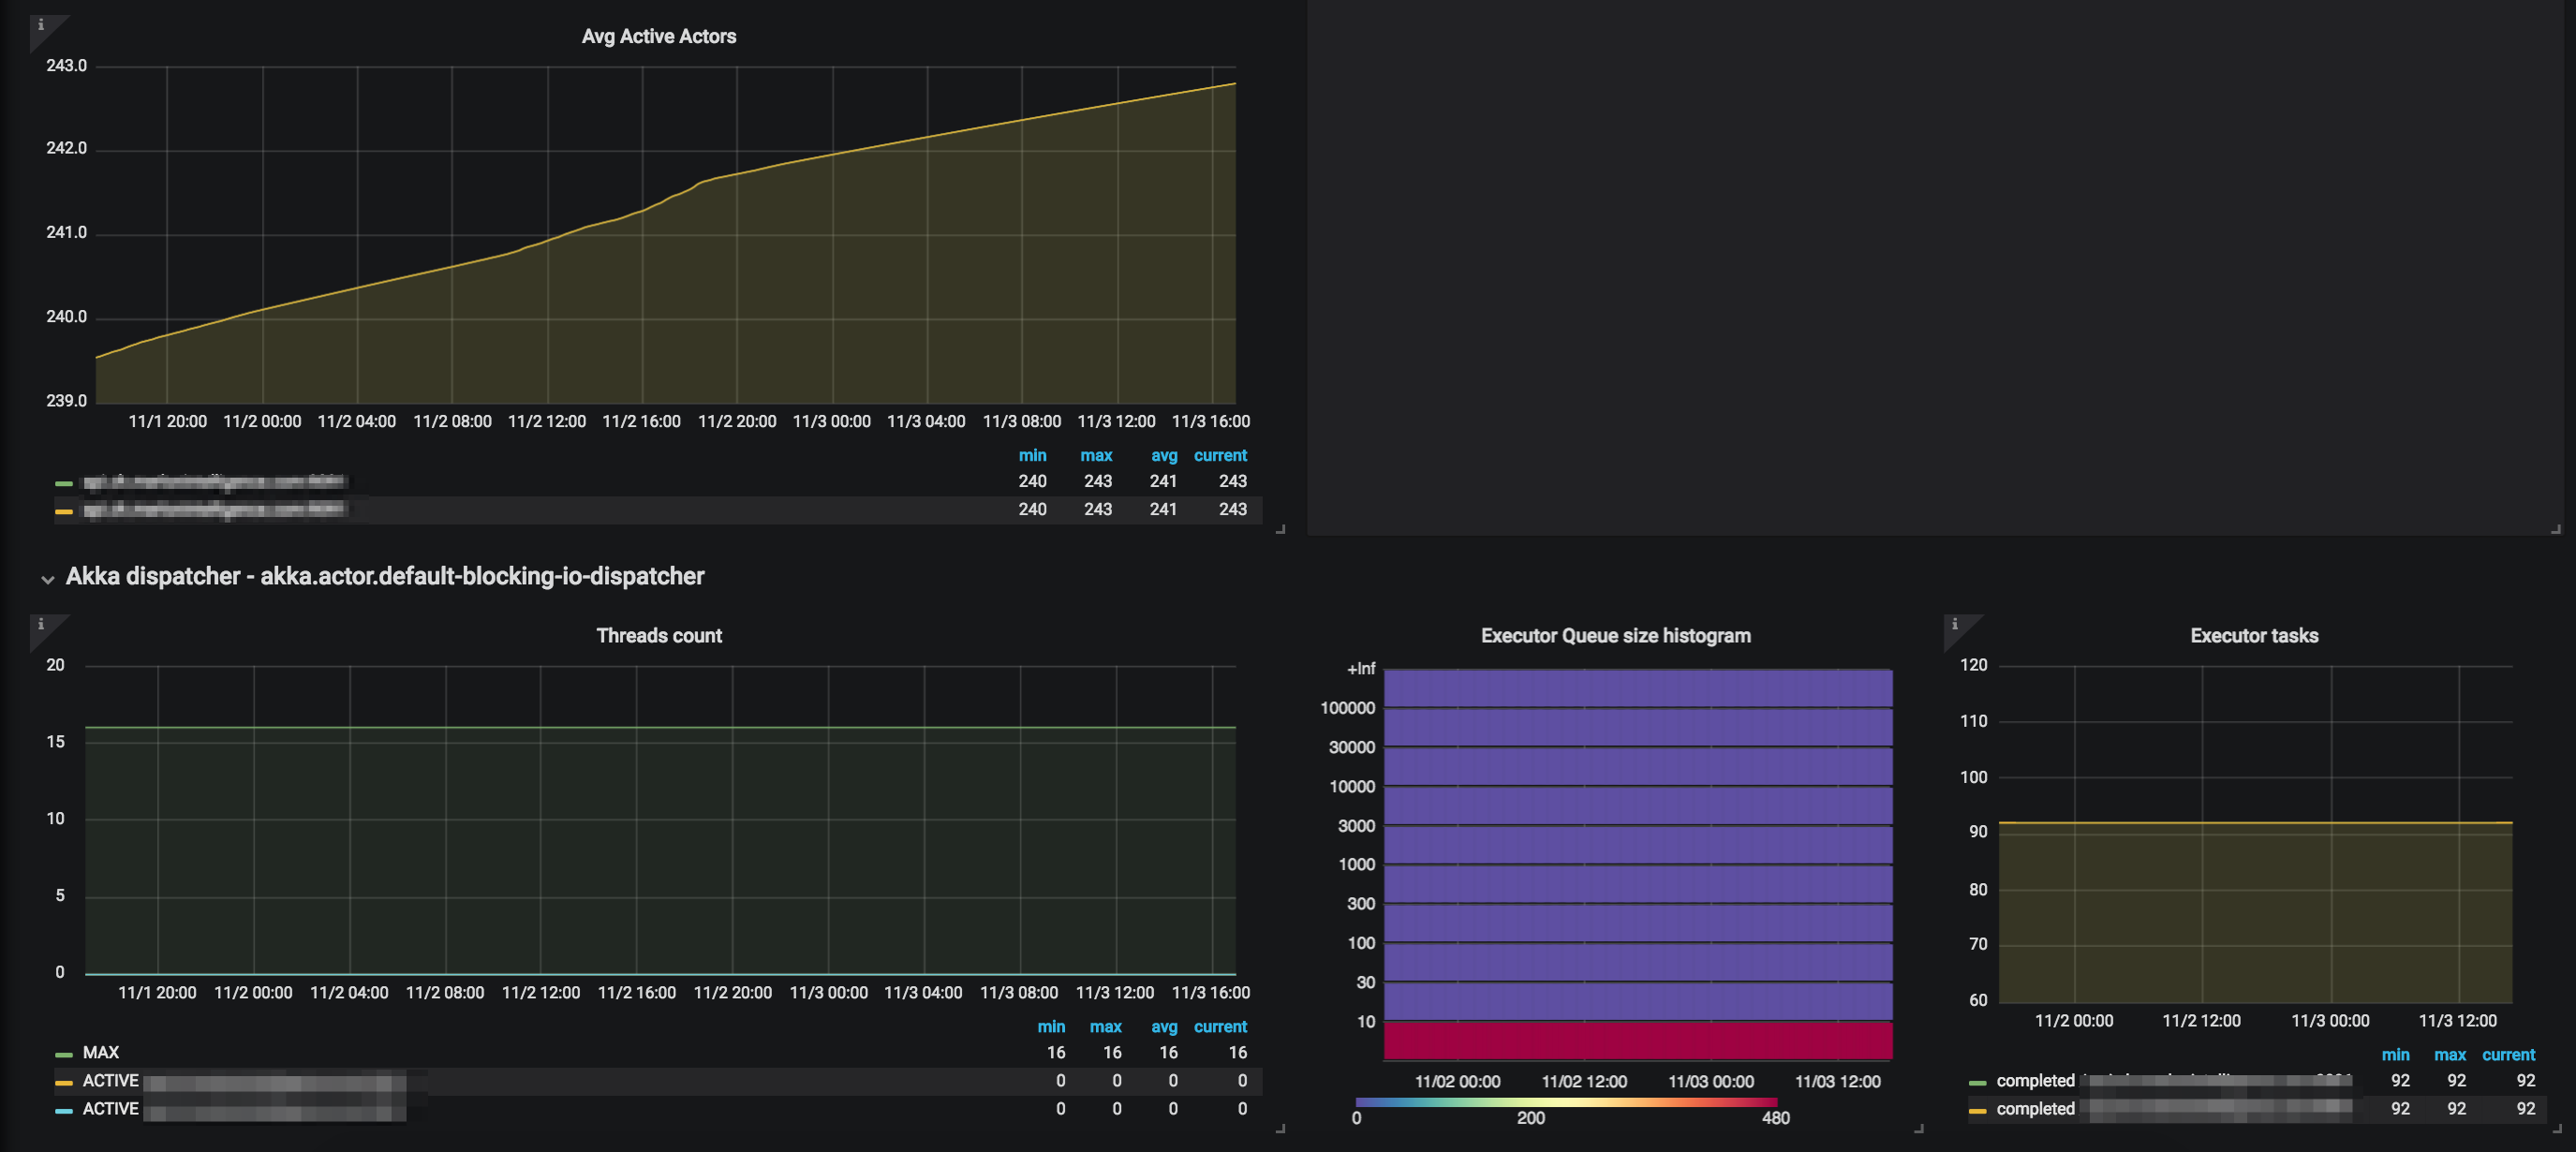
This dashboard monitors an Akka actor system by visualizing message flow, actor activity, and thread/executor load. Key metrics include akka_system_processed_messages_total, akka_system_dead_letters_total, and executor_queue_bucket (with related executor_tasks_total and thread counts) to track throughput, dead-letter/unhandled messages, and queue pressure. It combines per-metric panels like Avg Active Actors, Threads count, and Executor Queue size histogram to provide a concise view of system health and performance under load.
Screenshots
Used Metrics 1010
akka_system_active_actors_count
akka_system_active_actors_sum
akka_system_dead_letters_total
akka_system_processed_messages_total
akka_system_unhandled_messages_total
executor_pool
executor_queue_bucket
executor_tasks_total
executor_threads_count
executor_threads_sum