AdGuard Home Exporter 2,7002,700
3/28/2024
9/14/2025
8
>=12.1.1
Prometheus
Description
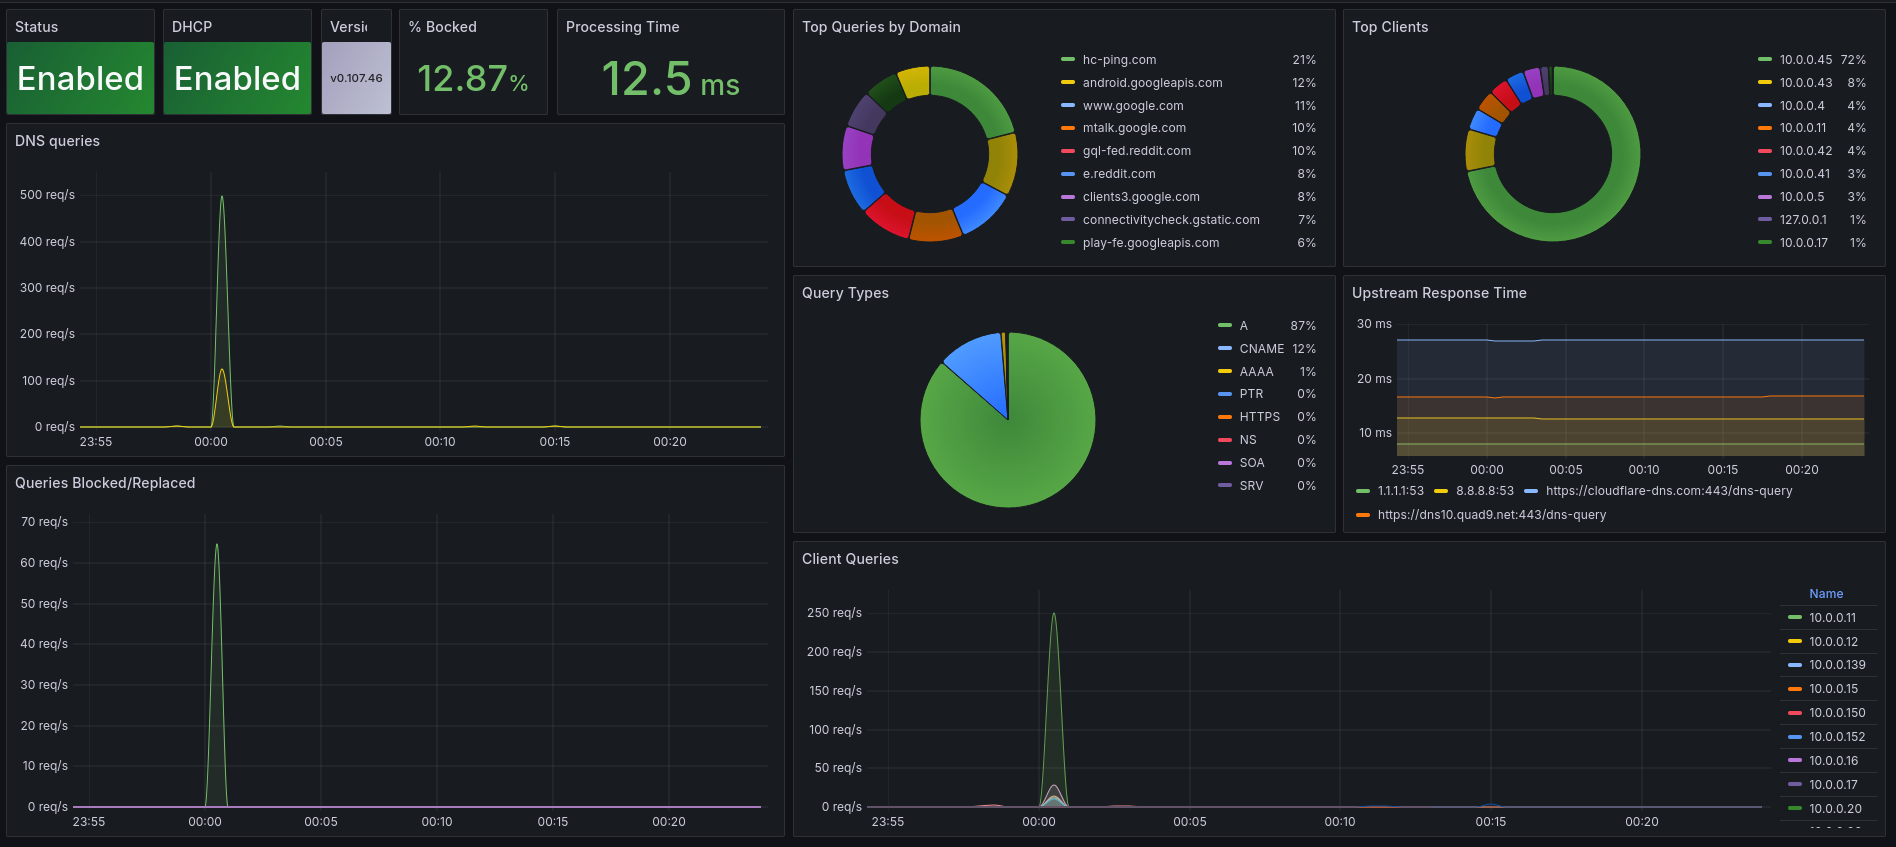
This is a AdGuard Home dashboard when using the https://github.com/henrywhitaker3/adguard-exporter Prometheus exporter
Screenshots
Used Metrics 1616
adguard_dhcp_enabled
adguard_dhcp_leases
adguard_processing_time_milliseconds_count
adguard_processing_time_milliseconds_sum
adguard_queries
adguard_queries_blocked
adguard_query_types
adguard_replaced_parental
adguard_replaced_safebrowsing
adguard_replaced_safesearch
adguard_running
adguard_top_blocked_domains
adguard_top_clients
adguard_top_queried_domains
adguard_top_upstreams
topk
Get Dashboard✕
Download
Copy to Clipboard