Adguard Exporter 1,300,7481,300,748 5.0 (1 reviews)
Description
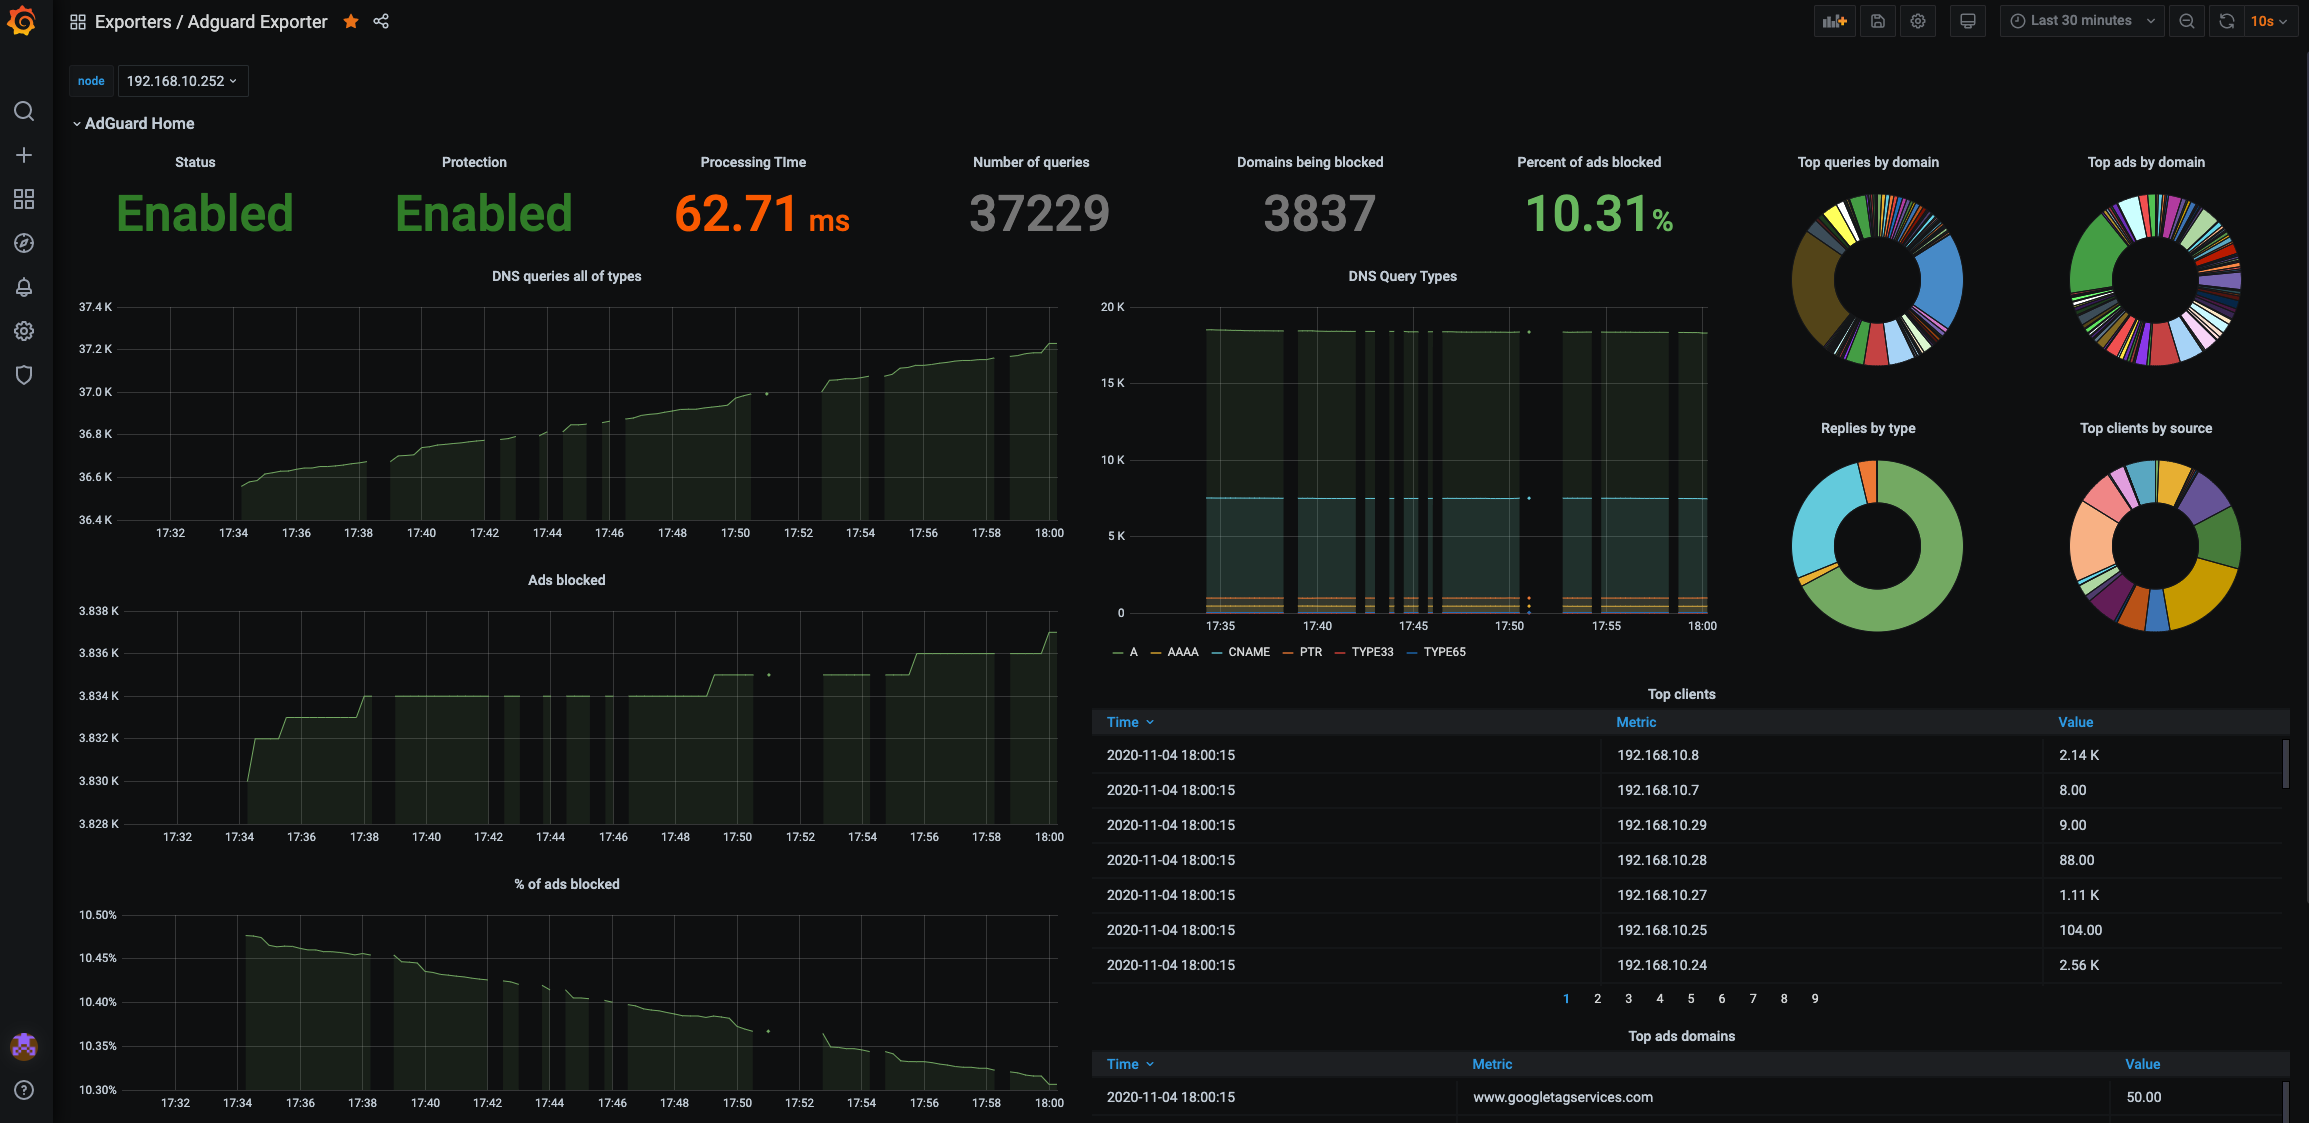
This dashboard monitors an AdGuard-based DNS filtering deployment, providing visibility into both operational health and filtering performance. It highlights key metrics such as adguard_running, adguard_avg_processing_time, and adguard_num_blocked_filtering to show service status, latency, and blocking activity, while panels like Top queries by domain and Top ads by domain reveal where and how ads are being filtered. It also includes DNS query types breakdown and Top clients by source to understand client behavior and protocol distribution across the network.
Screenshots
Used Metrics 99
adguard_avg_processing_time
adguard_num_blocked_filtering
adguard_num_dns_queries
adguard_protection_enabled
adguard_query_types
adguard_running
adguard_top_blocked_domains
adguard_top_clients
adguard_top_queried_domains