a Django Prometheus 125,405125,405 2.0 (1 reviews)
Description
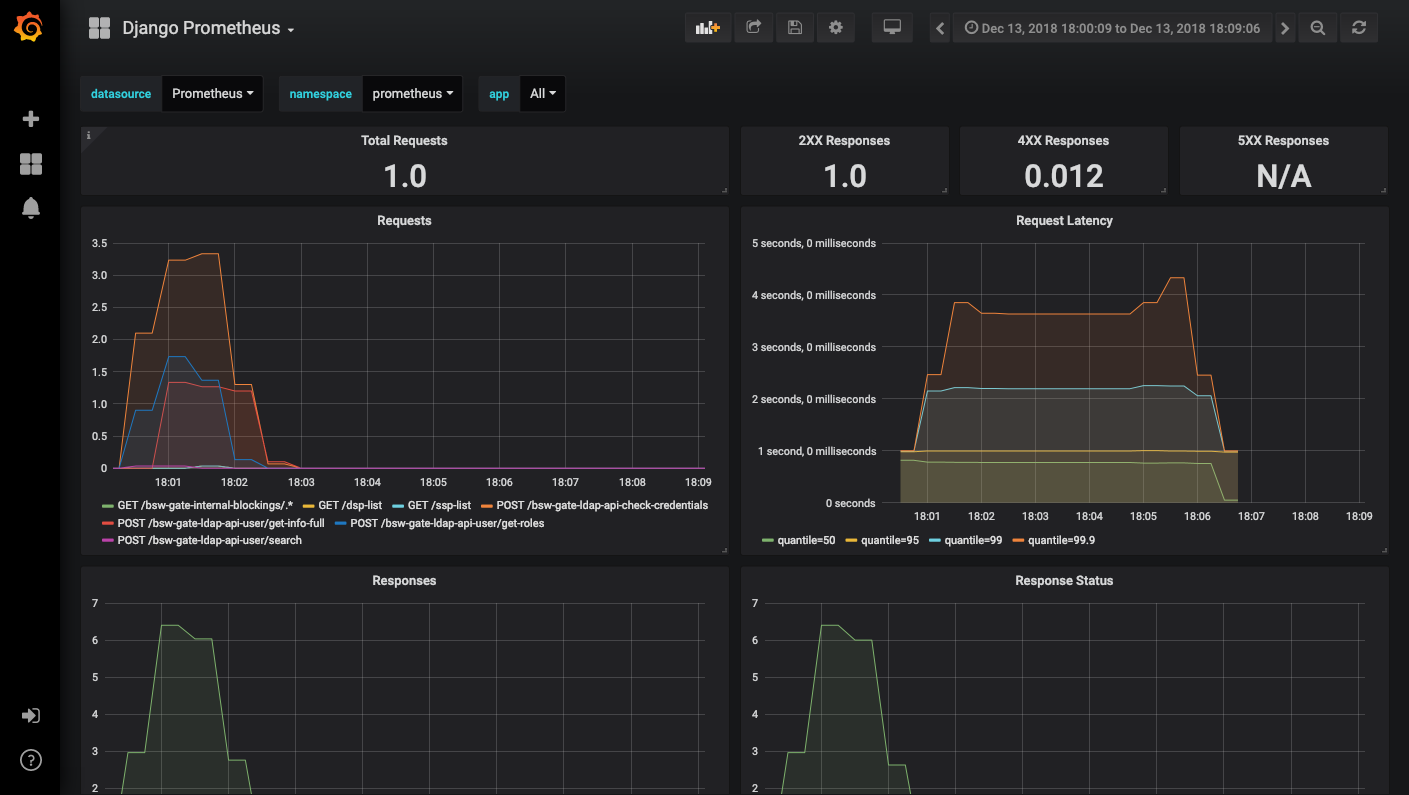
This dashboard monitors a Django application's observable metrics exposed to Prometheus, focusing on HTTP throughput, error rates, latency, and basic database operations. It highlights key indicators such as django_http_requests_total_by_transport_total and django_http_responses_total_by_status_total for request volume and response distribution, django_http_requests_latency_seconds_by_view_method_bucket for latency profiling, and database activity via django_db_execute_total along with model operation counters like django_model_inserts_total, django_model_updates_total, and django_model_deletes_total to track ORM-level activity. Expect concise time-series insights, including status breakdowns (2xx/4xx/5xx), request counts by view/transport, and latency buckets, enabling quick performance and reliability assessment.
Screenshots
Used Metrics 99
django_db_execute_total
django_http_requests_latency_seconds_by_view_method_bucket
django_http_requests_total_by_transport_total
django_http_requests_total_by_view_transport_method_total
django_http_responses_before_middlewares_total
django_http_responses_total_by_status_total
django_model_deletes_total
django_model_inserts_total
django_model_updates_total