Kubernetes Pods/Containers Resources 4,1934,193
2/17/2019
2/18/2019
2
>=5.4.3
Dashboard for k8s clusters that use kube-prometheus for collecting metrics.
About Dashboard
This dashboard will help you visualize resource utilization per pod or container.
Graph panels
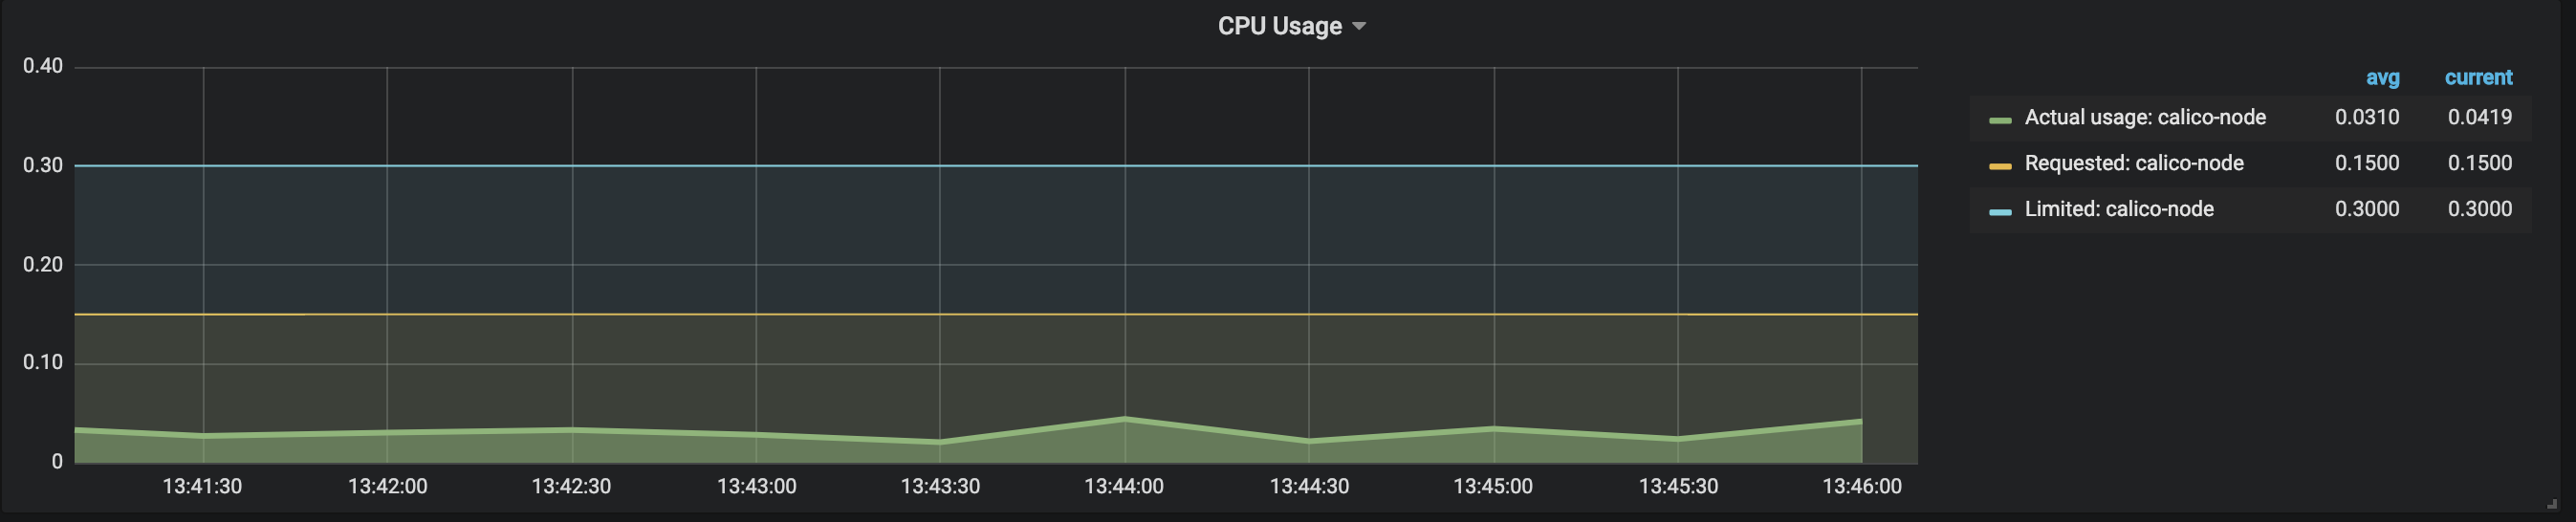
CPU
- Actual usage
- Requested
- Limited
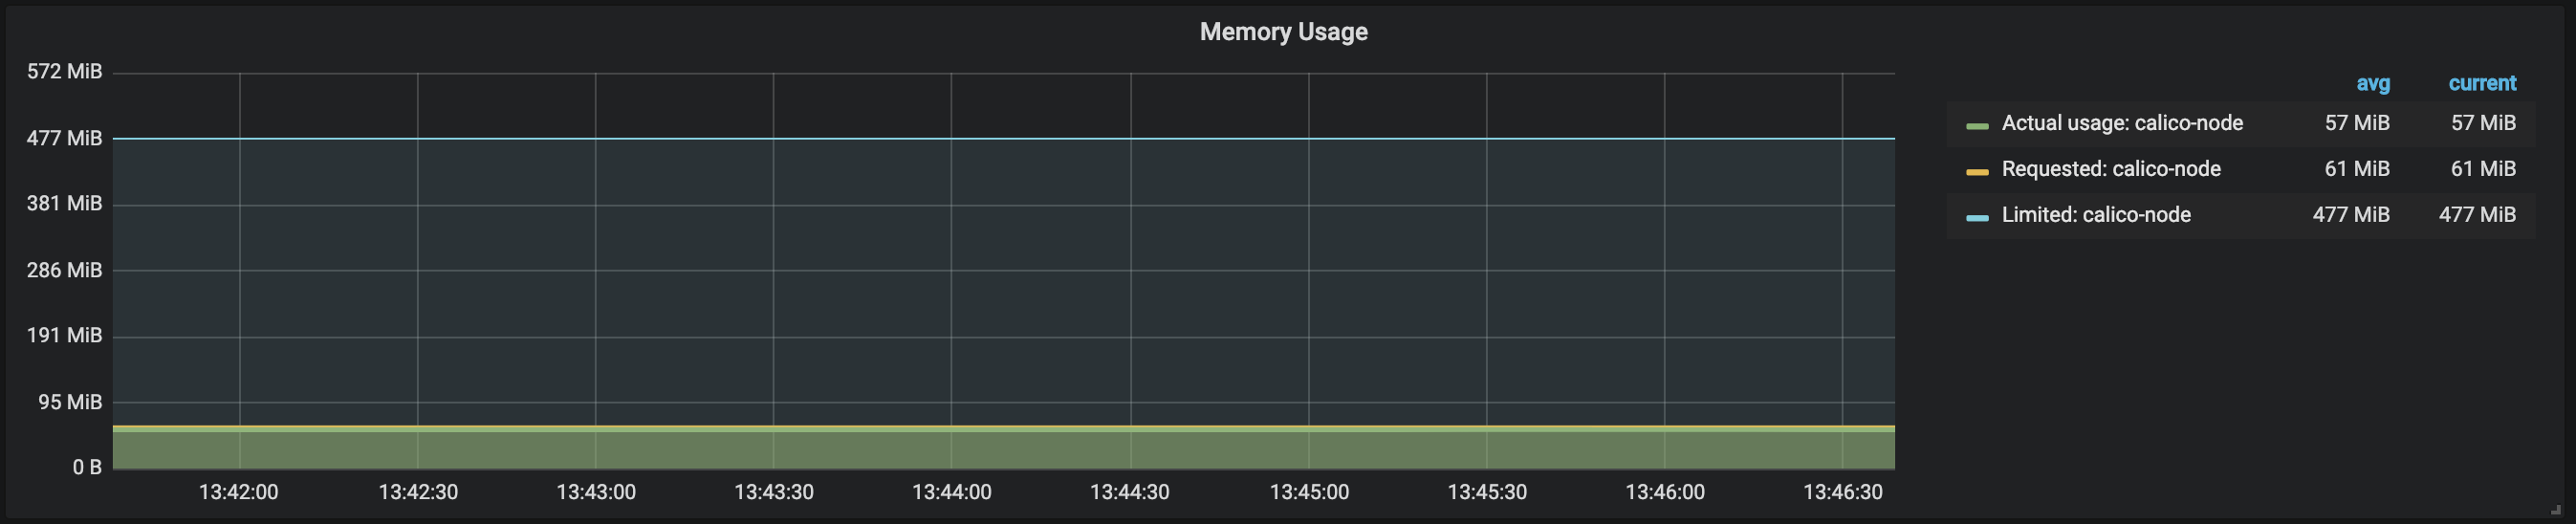
RAM
- Actual usage
- Requested
- Limited
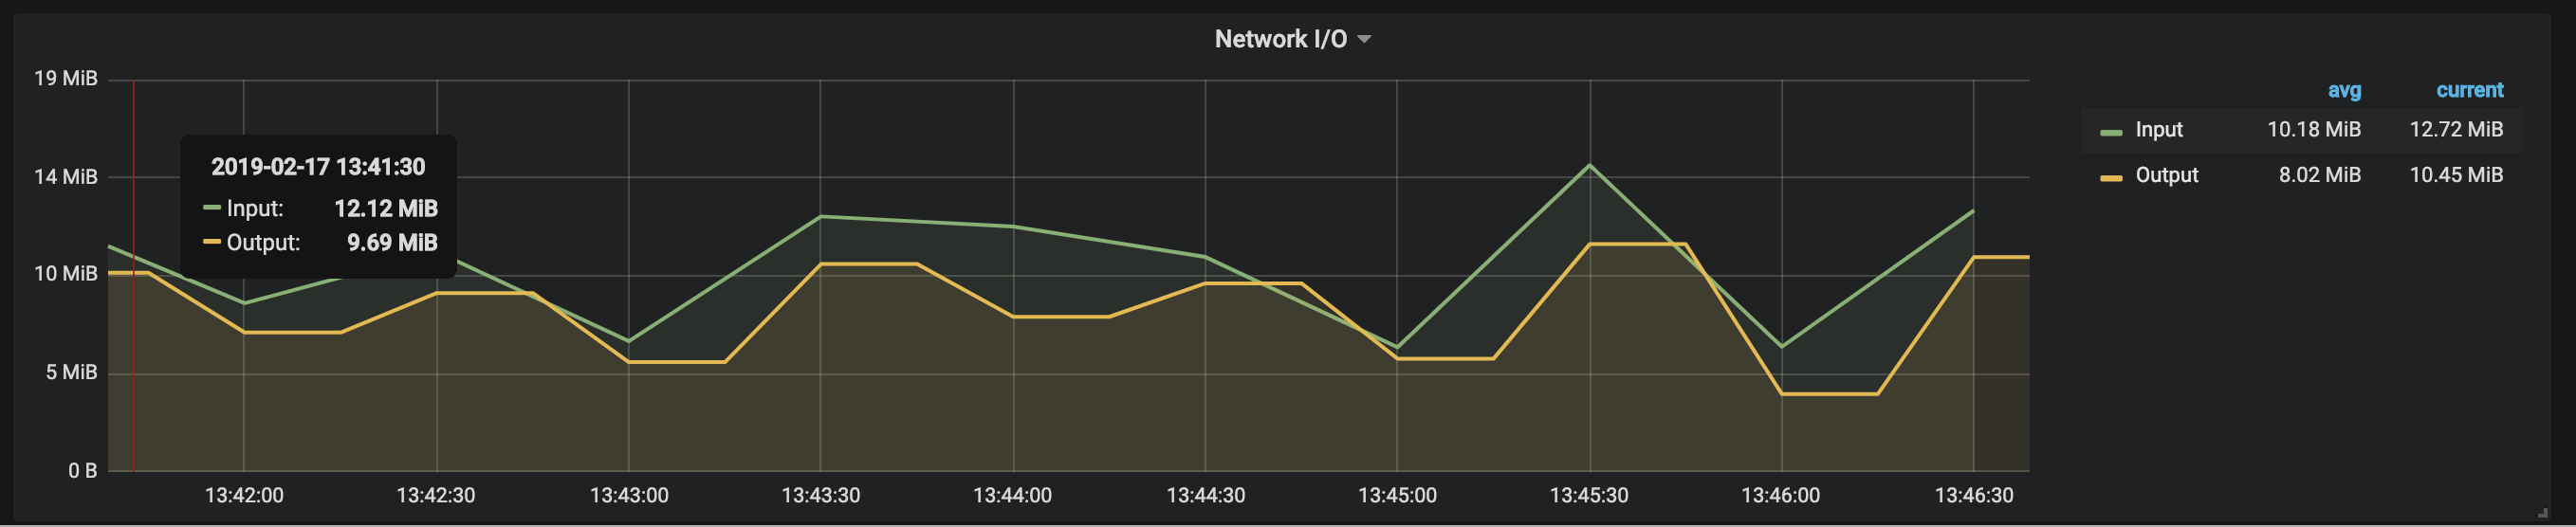
Network
- Input
- Output
How to use
After importing dashboard - create variable $source that will contain the datasource (if you are using different datasources for different cluster), or just hardcode it.
How to contribute
Feel free to make PR in github repository.
Other k8s resources dashboards
Export Dashboard✕
Download
Copy to Clipboard
Used Metrics 88
-
container_cpu_usage_seconds_total
kube_pod_container_resource_requests_cpu_cores
kube_pod_container_resource_limits_cpu_cores
-
container_memory_usage_bytes
kube_pod_container_resource_requests_memory_bytes
kube_pod_container_resource_limits_memory_bytes
-
container_network_receive_bytes_total
-
container_network_transmit_bytes_total