9115 - blackbox 245,726245,726
12/16/2020
12/16/2020
1
>=7.3.5
Prometheus
Description
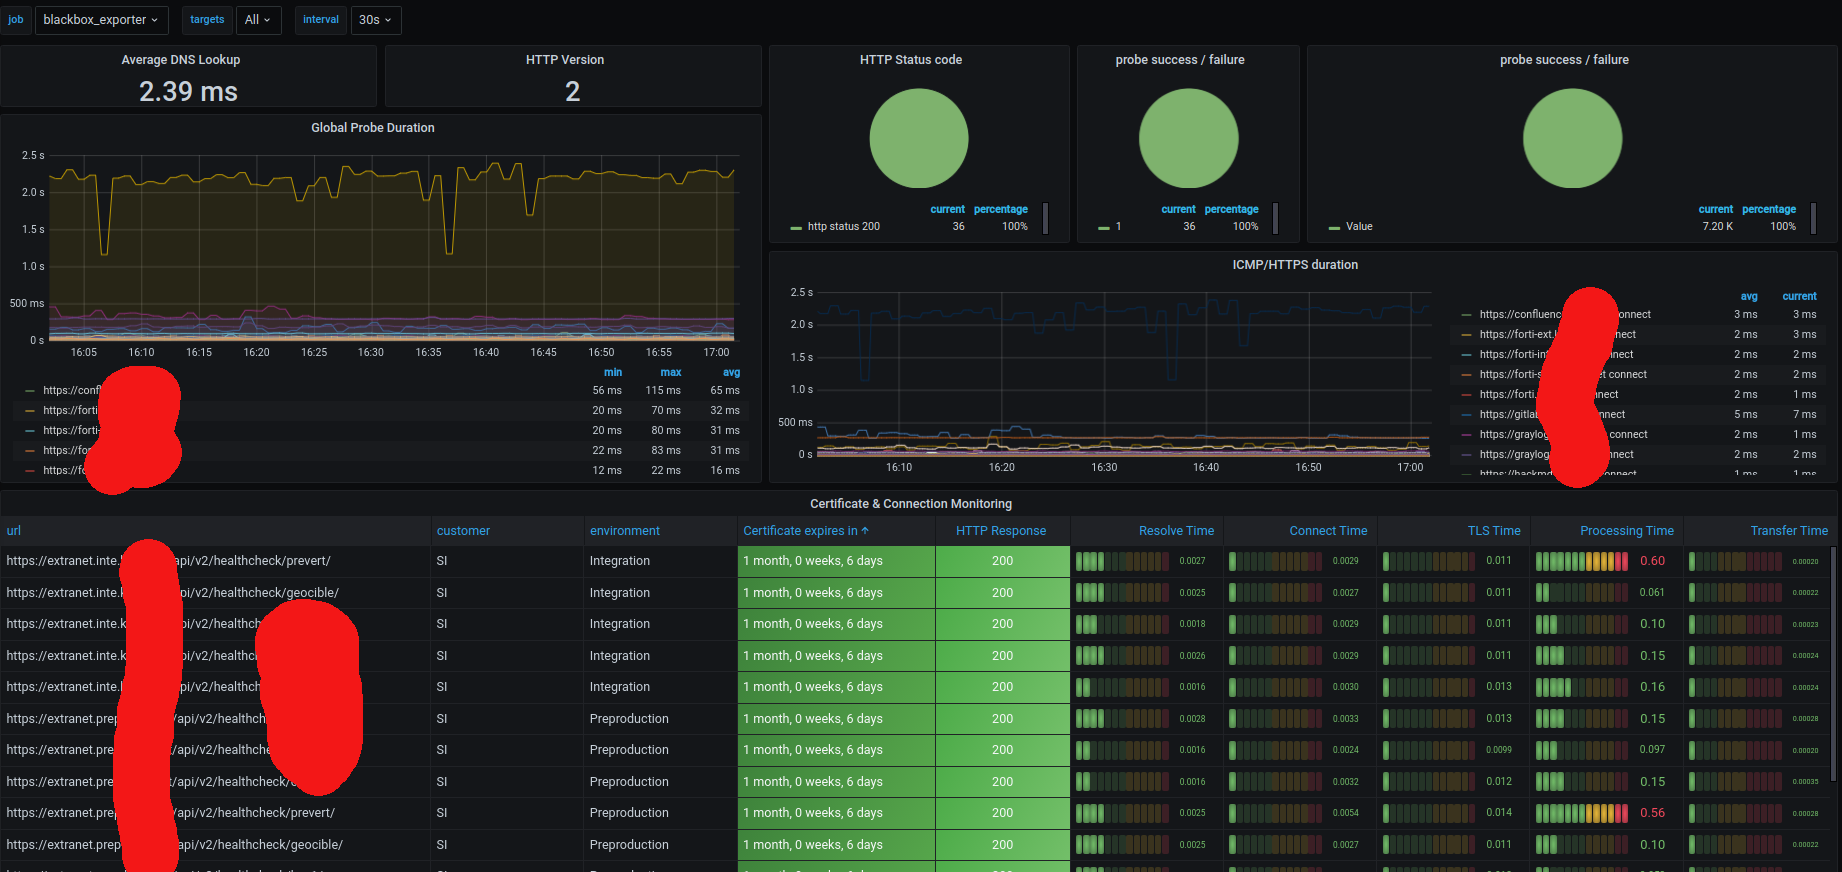
This dashboard monitors and visualizes the health and performance of remote probes using the blackbox exporter. It emphasizes uptime and reliability with metrics such as probe_success, probe_http_status_code, and probe_duration_seconds, while also providing at-a-glance insight into DNS resolution via probe_dns_lookup_time_seconds and TLS/SSL readiness through probe_http_ssl and probe_ssl_earliest_cert_expiry. Overall, it combines global status, probe durations, and certificate/connection monitoring to quickly identify failures and performance regressions.
Screenshots
Get Dashboard✕
Download
Copy to Clipboard