Traefik 1.6+ - Updated 1,8921,892
10/3/2018
10/3/2018
1
Web Servers
>=5.0.1
Prometheus
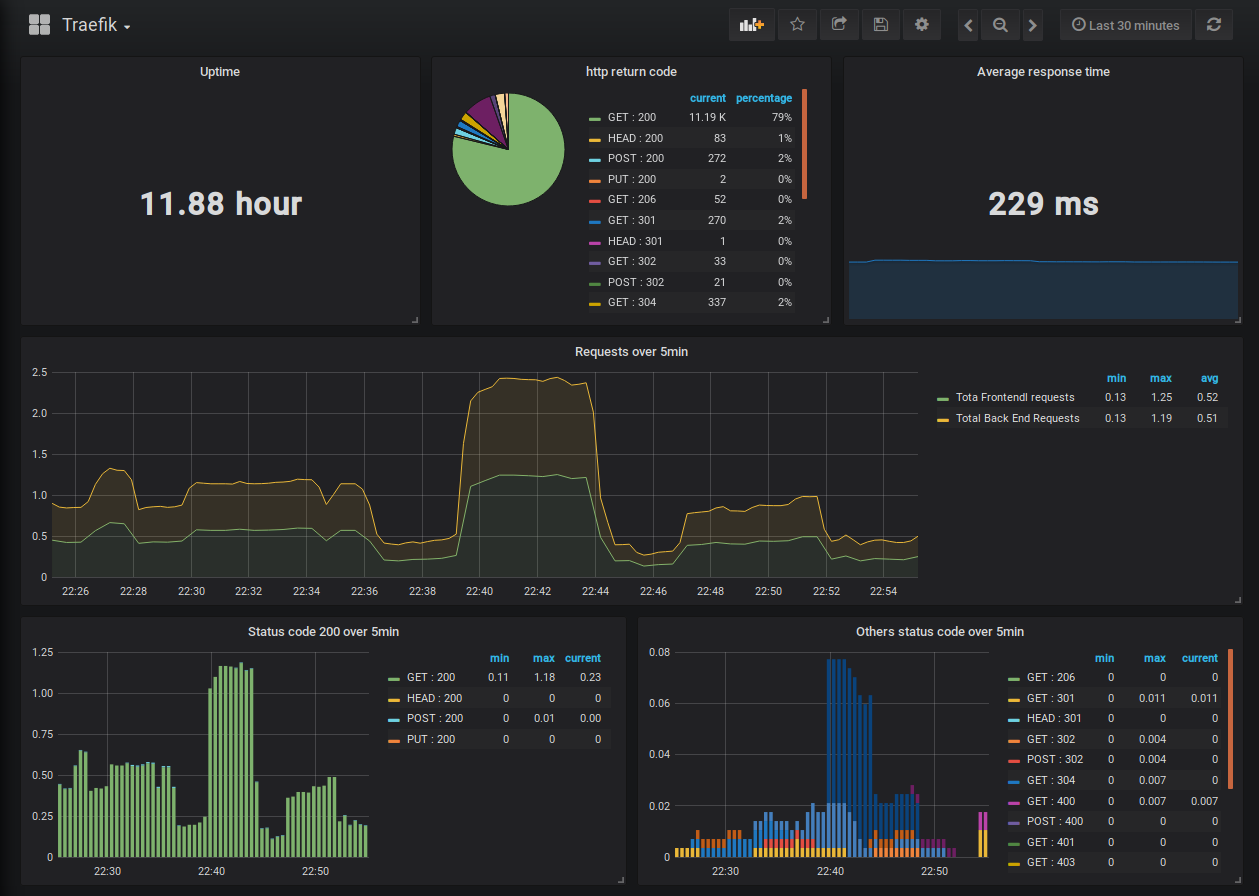
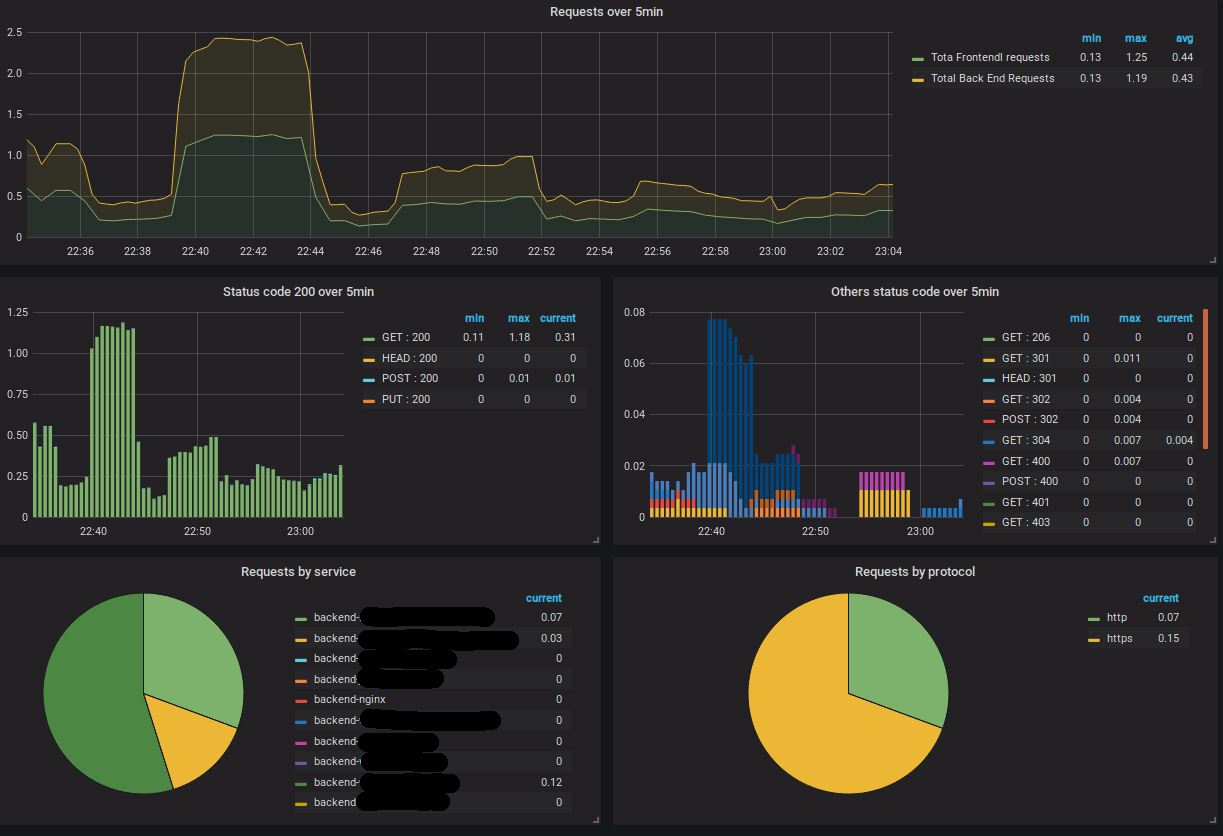
This dashboard has been updated to work with treafik 1.6+ using the --metric --metrics.prometheus metrics. The original was created by Thomas Cheronneau Dash board 4475.
Export Dashboard✕
Download
Copy to Clipboard
Used Metrics 55
-
process_start_time_seconds
traefik_entrypoint_requests_total
traefik_entrypoint_request_duration_seconds_sum
traefik_backend_request_duration_seconds_sum
traefik_backend_requests_total